Releases: netdata/netdata
v1.11.1
This is a patch - bug fix release of netdata.
Our work to move all the documentation inside the repo is still in progress. Everything has been moved, but still we need to refactor a lot of the pages to be more meaningful.
The README file on netdata home has been rewritten. Check it here.
Improved internal database
Overflown incremental values (counters) do not show a zero point at the charts. Netdata detects the width (8bit, 16bit, 32bit, 64bit) of each counter and properly calculates the delta when the counter overflows.
The internal database format has been extended to support values above 64bit.
New data collection plugins
openldap, to collect performance statistics from OpenLDAP servers.tor, to collect traffic statistics from Tor.nvidia_smito monitor NVIDIA GPUs.
Improved data collection plugins
- BUG FIX: network interface names with colon (
:) in them were incorrectly parsed and resulted in faulty data collection values. - BUG FIX:
smartd_loghas been refactored, has better python v2 compatibility, and now supports SCSI smart attributes cpufreqhas been re-written in C - since this module if common, we decided to convert to an internal plugin to lower the pressure on the python ones. There are a few more that will be transitioned to C in the next release.- BUG FIX:
sensorsgot some compatibility fixes and improved handling forlm-sensorserrors.
Health monitoring
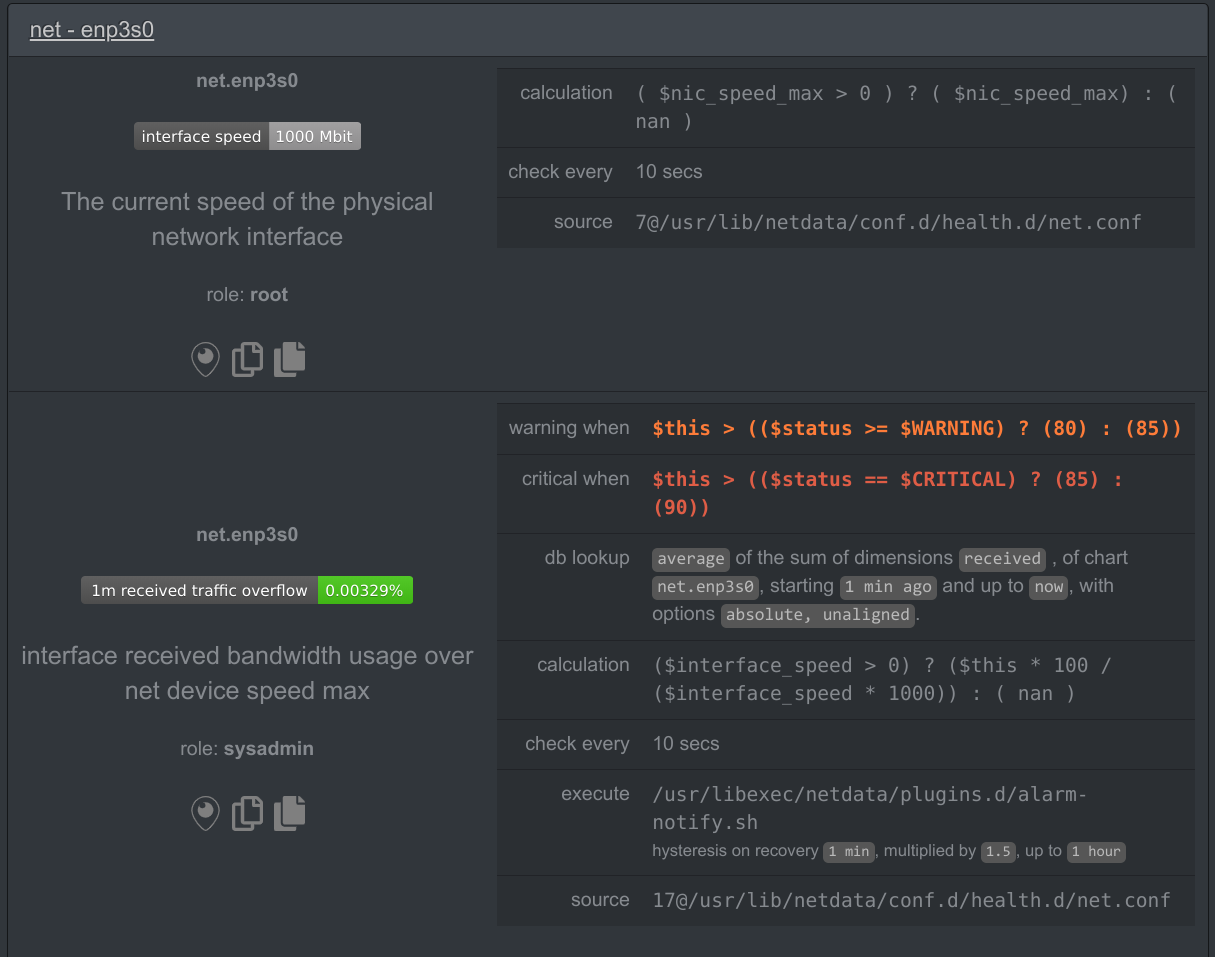
- BUG FIX: max network interface speed data collection was faulty, which resulted in false-positive alarms on systems with multiple interfaces using different speeds (the speed of the first network interface was used for all network interfaces). Now the interface speed is shown as a badge:
-
alerta.ionotifications got a few improvements -
BUG FIX:
conntrack_maxalarm has been restored (was not working due to an invalid variable name referenced)
Registry (my-netdata menu)
It has been refactored a bit to reveal the URLs known for each node and now it supports deleting individual URLs.
Packaging
openrcservice definition got a few improvements
v1.11.0
New to netdata? Check its demo: https://my-netdata.io
Hi all,
It has been 8 months since the last release of Netdata. We delayed releases a bit, but as you can see on these release notes, we were working hard to provide the best Netdata ever.
Thanks to synacktiv.com and red4sec.com, we fixed a number of vulnerabilities in the code base (check below), so release 1.11 of Netdata is the most secure Netdata so far. All users are advised to update to this version asap.
Netdata now has its own organization on GitHub. So, we moved from firehol/netdata to netdata/netdata! We also provide new docker images as netdata/netdata (the old ones are deprecated and are not updated any more).
Netdata community grows faster than ever. Currently netdata grows by +2k unique users and +1k unique installations per day, every day!
Contributions sky rocket too. To make it even easier for newcomers to get involved, we modularized all the code, now organized into a hierarchy of directories. We also moved most of the documentation, from the wiki into the repo. This is quite unique. Netdata is one of the first projects that organizes code and docs under the same hierarchy. Browse the repo; you will be surprised! Examples: data collection plugins, database, backends, web server, ARL, including benchmarks, etc.
Many thanks to all the contributors that help building, enhancing and improving a project useful and helpful to hundreds of thousands of admins, devops and developers around the world!
You rock!
Automatic Updates broken
There was an accidental breaking change in the master repo of netdata.
All users that use automatic updates, are advised to run:
sudo sh -c 'cd /usr/src/netdata.git && git fetch --all && git reset --hard origin/master && ./netdata-updater.sh -f'After that, netdata-updater will be able to update your netdata.
Stock config files are now in /usr/lib/netdata
We prepare netdata for binary packages. This required stock config files to be overwritten unconditionally when new netdata binary packages are installed. So, all config files we ship with netdata are now installed under /usr/lib/netdata/conf.d.
To edit config files, we have supplied the script /etc/netdata/edit-config that automatically moves the config file you need to edit to /etc/netdata and opens an editor for you.
New query engine
The query engine of netdata has been re-written to support query plugins. We have already added the following algorithms that are available for alarm, charts and badges:
stddev, for calculating the standard deviation on any time-frame.sesoremaorewma, for calculating the exponential weighted moving average, or single/simple exponential smoothing on any time-frame.des, for calculating the double exponential smoothing on any time-frame.cvorrsd, for calculating the coefficient of variation for any time-frame.
Fixed Security Issues
Identified by Red4Sec.com
CVE-2018-18836Fixed JSON Header Injection (an attacker could send\nencoded in the request to inject a JSON fragment into the response).CVE-2018-18837Fixed HTTP Header Injection (an attacker could send\nencoded in the request to inject an HTTP header into the response).CVE-2018-18838Fixed LOG Injection (an attacker could send\nencoded in the request to inject a log line ataccess.log).CVE-2018-18839Not fixed Full Path Disclosure, since these are intended (netdata reports the absolute filename of web files, alarm config files and alarm handlers).
Identified by Synacktiv
- Fixed Privilege Escalation by manipulating
apps.pluginorcgroup-networkerror handling. - Fixed LOG injection (by sending URLs with
\nin them).
Packaging
- Our official docker hub images are now at
netdata/netdata. These images are based on Alpine Linux for optimal footprint. We provide images fori386,amd64,aarch64andarmhf. - the supplied
netdata.servicenow allows configuring process scheduling priorities exclusively onnetdata.service(no need to changenetdata.conftoo). - the supplied
netdata.serviceis now installed in/usr/lib/systemd/system. - Stock netdata configurations are now installed in
/usr/lib/netdata/conf.dand a new script has been added to allow easily copying and editing config files:/etc/netdata/edit-config.
New Data Collection Modules
rethinkdbsfor monitoring RethinkDB performanceproxysqlfor monitoring ProxySQL performancelitespeedfor monitoring LiteSpeed web server performance.uwsgifor monitoring uWSGI performanceunboundfor monitoring the performance of Unbound DNS servers.powerdnsfor monitoring the performance of PowerDNS servers.dockerdfor monitoring the health of dockerdpuppetfor monitoring Puppet Server and Puppet DB.logindfor monitoring the number of active users.adaptec_raidandmegaclifor monitoring the relevant raid controllerspigotmcfor monitoring minecraft server statisticsboincfor monitoring Berkeley Open Infrastructure Network Computing clients.w1sensorfor monitoring multiple 1-Wire temperature sensors.monitfor collecting process, host, filesystem, etc checks from monit.linux_power_suppliesfor monitoring Linux Power Supplies attributes
Data Collection Orchestrators Changes
node.d.plugindoes not use thejscommand any more.python.d.pluginnow usesmonotonicclocks. There was a discrepancy in clocks used in netdata that resulted in a shift in time of python module after some time (it was missing 1 sec per day).- added
MySQLServicefor quickly adding plugins using mysql queries. URLServicenow supports self-signed certificates and supports custom client certificates.- all
python.d.pluginmodules that requiresudoto collect metrics, are now disabled by default, to avoid security alarms on installations that do not need them.
Improved Data Collection Modules
apps.pluginnow detects changes in process file descriptors, also fixed a couple of memory leaks. Its default configuration has been enriched significantly, especially for IoT.freeipmi.pluginnow supports optionignore-statusto ignore the status reported by given sensors.
statsd.plugin (for collecting custom APM metrics)
- The charting thread has been optimized for lowering its CPU consumption when several millions of metrics are collected.
setsnow report zeros instead of gaps when no data are collectedhistogramsandtimershave been optimized for lowering their CPU consumption to support several thousands of such metrics are collected.histogramshad wrong sampling rate calculations.gaugesnow ignore sampling rate when no sign is included in the value.- the minimum sampling rate supported is now 0.001.
- netdata statsd is now drop-in replacement for datadog statsd (although statsd tags are currently ignored by netdata).
proc.plugin (Linux, system monitoring)
- Unused interrupts and softirqs are not used in charts (this saves quite some processing power and memory on systems with dozens of CPU cores).
- fixed `/proc/net/...
v1.10.0
New to netdata? Check its demo: https://my-netdata.io
Posted on twitter, facebook, reddit r/linux,
Hi all,
Another great netdata release: netdata v1.10.0 !
This is a birthday release: netdata is now 2 years old !
Many thanks to all the contributors that help building, enhancing and improving a project useful and helpful for thousands of admins, devops and developers around the world! You rock!
- @ktsaou
At a glance
netdata now has a new web server (called static) with a fixed number of threads, providing a lot better performance and finer control of the resources allocated to it.
All dashboard elements (javascript) have been updated to their latest versions - this allows a smoother experience when embedding netdata charts on third party web sites and apps.
IMPORTANT: all users using older netdata are advised to update to this version. This version offers improved stability, security and a huge number of bug fixes, compared to any prior version of netdata.
new plugins
- BTRFS - monitor the allocations of BTRFS filesystems (yes, netdata can now properly detect when btrfs is going out of space)
- BCACHE - monitor the caching block layer that allows building hybrid disks using normal HDDs and SSDs
- Ceph - monitor ceph distributed storage
- nginx plus - monitor the nginx+ web servers
- libreswan - monitor IPSEC tunnels
- Traefik - monitor traefik reverse proxies
- icecast - monitor icecast streaming servers
- ntpd - monitor NTP servers
- httpcheck - monitor any remote web server
- portcheck - monitor any remote TCP port
- spring-boot - monitor java spring boot applications
- dnsdist - monitor dnsdist name servers
- hugepages - monitor the allocation of Linux hugepages
enhanced / improved plugins
- statsd
- web_log
- containers monitoring
- system memory
- diskspace
- network interfaces
- postgres
- rabbitmq
- apps.plugin
- haproxy
- uptime
- ksm
- mdstat
- elasticsearch
- apcupsd
- isc-dhcpd
- fronius
- stiebeleltron
new alarm notifications methods
- alerta
- IRC
And as always, hundreds more enhancements, improvements and bugfixes.
BTRFS monitoring
BTRFS space usage monitoring and related alarms.
netdata is able to detect if any of the space-related components (physical disk allocation, data, metdata and system) of BTRFS is about the become exhausted!
#3150 - thanks to @Ferroin for explaining everything about btrfs...

bcache monitoring
netdata now monitors bcache metrics - they are automatically added to any disk that is found to be a bcache disk.
ceph monitoring
New plugin to monitor ceph, the unified, distributed storage system designed for excellent performance, reliability and scalability (#3166 @lets00).
containers and VMs monitoring
- netdata now monitors
systemd-nspawncontainers. - netdata now renames charts of kubernetes containers.
virshis now called with-rto avoid prompting for password #3144cgroup-networkis now a lot more strict, preventing unauthorized privilege escalation #3269cgroup-networknow searches for container processes in sub-cgroups too - this improves the mapping of network interfaces to containerscgroup-networknow works even when there are novethinterfaces in the system
monitor ntpd
netdata can now monitor isc-ntpd. @rda0 did a marvelous job decoding NTP Control Message Protocol, collecting ntpd metrics in the most efficient way #3421, #3454 @rda0

btw, netdata also monitors
chronybut the chrony module of netdata is disabled by default, because certain CentOS versions ship a version of chrony that consumes 100% cpu when queried for statistics.
nginx plus web servers monitoring
Added python plugin to monitor the operation of nginx plus servers. The plugin monitors everything about nginx+, except streaming #3312 @l2isbad
libreswan IPSEC tunnels monitoring
netdata now monitors libreswan tunnels - #3204

remote HTTP/HTTPS server monitoring
netdata now has an httpcheck plugin (module of python.d.plugin), that can query remote http/https servers, track the response timings and check that the response body contains certain text #3448 @ccremer .

remote TCP port monitoring
netdata now has portcheck plugin (module of python.d.plugin), that can check any remote TCP port is open #3447 @ccremer

icecast streaming server monitoring
netdata now monitors icecast servers #3511 @l2isbad.
traefik reverse proxy monitoring
netdata now monitors traefik reverse proxies - #3557.
spring-boot monitoring
netdata can now monitor java spring-boot applications @Wing924


dnsdist
netdata now monitors dnsdist name servers - @Nobody-Nobody #3009
statsd
- statsd dimensions now support the options the external plugin dimensions support (currently the only usable option is
hiddento add the dimension, but make it hidden on the dashboard - a hidden dimension can participate in various calculations, including alarms). - statsd now reports the CPU usage of its threads at the netdata section.
- statsd metrics are logged to access.log the first time they are encountered.
- statsd metrics now accept the special value
zinitto allow them get initialized without altering their values (this is useful if you have rare metrics that you need to initialize when netdata starts). - statsd over TCP is now a lot faster - netdata can process up to 3.5mil statsd metrics / second using just one core. Added options to control the timeouts of TCP statsd connections.
- fixed the title and context of statsd private charts
- statsd private charts can now be hidden from the dashboard #3467
postgres
Several new charts have been added to monitor (#3400 by @anayrat):
- checkpointer charts
- bgwriter charts
- autovacuum charts
- replication delta charts
- WAL archive charts
- WAL charts
- temporary files charts
Also, the postgres plugin now also works when postgres is in recovery mode.
rabbitmq
- added Erlang run queue chart. This is useful in conjunction with the existing Erlang processes chart to get a better overall idea of what's going on in the Erlang VM. @arch273
- added rabbitmq information on the dashboard to comple...
v1.9.0
New to netdata? Check its demo: https://my-netdata.io
Overview of netdata v1.9
-
snapshots
We can now save and load dashboard snapshots for any timeframe in any resolution. snapshots allow us to save artifacts, evidence, documentation of incidents, or just the raw data for postmortem analysis. -
highlighted time-frame
We can now highlight a selected time-frame on all dashboard charts. So, to quickly compare charts press ALT or CONTROL and select an area on one chart. The same area will be highlighted on all charts. -
export to PDF
We can now export netdata dashboards to PDF, for any timeframe with any detail. -
access lists (IP filtering)
We can now setup IP filtering atnetdata.conffor all functions of netdata (dashboard access, streaming, registry, badges, etc - no more iptables rules for protecting netdata). -
TCP overflows and connection drops
netdata can now detect TCP listening sockets overflows and connection drops, for any server running on the host (even the ones netdata is not aware of). -
libvirt VMs
netdata now detects libvirt network interfaces and moves them to VM section of the dashboard (it also supports.libvirt-qemunaming of cgroups). -
Units auto-scaling
netdata dashboards can now scale units (KB->MB->GB->TB, etc), on the fly. -
Units conversions
netdata dashboards can now convert units (eg. Celsius to Fahrenheit, seconds to HH:MM:DD, etc), on the fly. -
Multiple Timezones
netdata dashboards can now change timezone on the fly (yes, we can now compare charts with server logs). -
python.d.plugin rewritten
@l2isbad rewrote the whole of it, to add flexibility and support the latest netdata features! The new plugin supports the old python modules. -
better / faster dashboard scrolling
netdata now uses passive event listeners to detect page scrolling. This improved significantly the responsiveness of the dashboard (check your dashboard settings:syncscrolling is the fastest,asyncis closer to the older behavior). -
netdata now monitors couchdb, powerdns, beanstalkd and dnsdist !
-
netdata now detects redis background save failures
-
netdata can now send flock.com and kavenegar.com alarm notifications
and as always... dozens more improvements, enhancements, new features and bug fixes!
netdata dashboard snapshots !
Netdata can now export and import dashboard snapshots.
Snapshots are JSON files containing everything the dashboard needs to be rendered: charts and chart data.
They are exported as JSON files, to your computer. The saved snapshots can be loaded back on any netdata dashboard (even of different host). When importing, not network traffic is generated. The web browser loads the local file and renders an interactive dashboard to examine it.
The current visible timeframe of the dashboard is respected, so first align the dashboard to the timeframe required and the click "Export". The pop-up allows selecting the resolution of the export (its detail).
highlighted time-frame !
Press the ALT or CONTROL key and select a time-frame at a chart. An overlay will appear with the selected time-frame and all the charts will highlight the same region.
The highlighted time-frame:
- Is added to the URL hash, so that reloading the page keeps it
- Is propagated to other netdata servers, via the
my-netdatamenu - Is save in dashboard snapshots (and of course restored when they are loaded back)

Also, netdata charts can now be zoomed vertically (use the SHIFT key, like in zoom, but select the chart vertically):

netdata dashboards to PDF !
netdata dashboards can now be printed to PDF. Just click the 🖨️ icon on the dashboard.
The current visible timeframe of the dashboard is respected, so first align the dashboard to the timeframe required and the click "Print".

netdata now supports API access lists (IP filtering)
netdata can now check the client IPs connecting to it and deny/allow access based on your settings. No more iptables rules to control access to netdata.
All these settings are netdata simple patterns that are checked against the client IP (string matching - not subnet matching). localhost clients (IPv4, IPv6 and unix domain sockets) can be matched with localhost:
Global access control
[web].allow connections fromto match the clients' IPs allowed to connect to netdata. This has the same effect with iptables (but implemented at the application level - so clients will get connected, and disconnected immediately if they are not allowed access, without any response from netdata).
Dashboard access control
netdata.conf:[web].allow dashboard fromto match the clients' IPs that are allowed to access the dashboard (ie fetch static files and query netdata API).netdata.conf:[web].allow badges fromto match the clients' IPs that are allowed to access badges (the dashboard clients are allowed to access badges too, so this setting allows badges to clients that do not have access to the dashboard).
Streaming access control
netdata.conf:[web].allow streaming fromto match the the clients' IPs that are allowed to stream to stream metrics.stream.conf:[API_KEY].allow fromto match the clients' IPs allowed to push metrics for the given API KEY.stream.conf:[MACHINE_GUID].allow fromto match the clients' IPs allowed to push metrics for the specific machine.
netdata will also check the API keys supplied by slaves and proxies connected.
Other access lists
netdata.conf:[web].allow netdata.conf fromto limit the clients that can getnetdata.conf- by default netdata allows only private IPs.netdata.conf:[registry].allow fromto limit the clients allowed to access the registry (only when this netdata acts as a registry).
netdata detects TCP listening sockets overflowing or dropping connections
Added a new chart: ipv4.tcplistenissues with dimensions ListenOverflows and ListenDrops.
This chart detects if any listening TCP socket on the host, is overflown, or it drops connections. This is system-wide: any listening TCP socket, of any application.
The chart will not be shown if these kernel counters are zero. It will be enabled automatically if it is found non-zero at any point (it is collected via /proc/net/netstat every second). If you need to enable it even if it is zero, edit netdata.conf and set:
[plugin:proc:/proc/net/netstat]
	TCP listen issues = yes
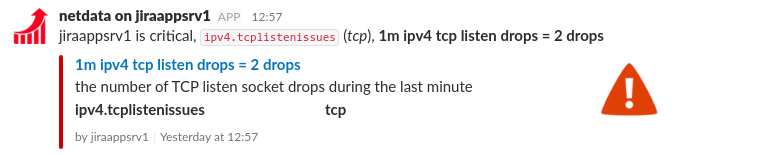
Two alarms have been added, one for ListenOverflows and one for ListenDrops that detect if there is any overflow or drop in the last minute (they run every 10 seconds).
slack alarm for overflows:

slack alarm for drops:
and the alarms configuration:
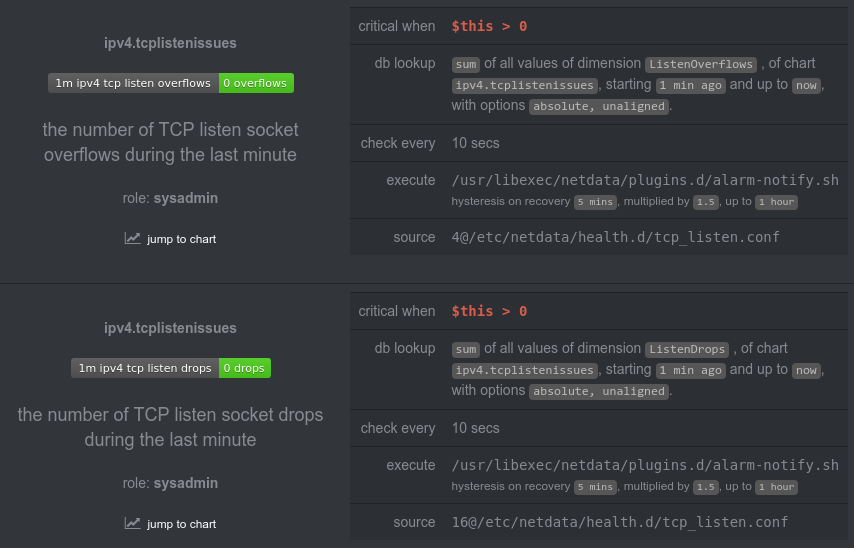
The alarms will automatically be attached when the chart is active.
The overflows dimension and alarm is supported on FreeBSD too.
/proc/net/sockstat and /proc/net/sockstat6
These files provide sockets statistics for all protocols.
. The alarms were generated and were visible at the dashboards, but the notifications were not always sent.
bug fix: streamed charts with duplicate names
There was a minor issue with charts that were created with name aliases. When these charts were streamed from netdata slaves to netdata masters, they ended up with duplicate chart names (ie instead of type.name they had type.type.name).
key containers monitoring improvements
-
Container network interfaces are now moved to the container section and they are rendered from the container view point (i.e.
sent= what the container sent) - no moreveth*garbage on the dashboard. -
The interfaces also appear as
eth0(or whatever the container sees) and they are inside the container section of the dashboard. netdata maps eachveth*interface to the right container, using plaincgroupsfeatures, so this works for all container managers (docker, lxc, etc). -
Eliminated the nested containers shown under certain versions of
lxc. -
Also, containers and VMs now have summary gauges on the dashboard

key plugins improvements
python.d.plugin now supports HTTP keep-alive
netdata now uses urllib3 (shipped with netdata for both python v2 and v3) for URLService based plugins.
This enables HTTP keep-alive on all connections, which allows netdata to have permanent connections to third party web applications.
Fixed by @l2isbad
compatibility enhancements
- better support for Oracle Linux, by @schindlerd
- better support for Alpine Linux
- various fixes at the build procedure for macOS
fpingcan now run as non-root, in static binary netdata packages
netdata generic enhancements
-
netdata can now listen on UNIX domain sockets (
.sockfiles). This allows a local web server and netdata to communicate bypassing the network stack (for netdata setbind to = unix:/path/to/netdata.sock- this option supports multiple arguments, so netdata can listen to multiple unix sockets and tcp sockets, at the same time). -
netdata was assuming that the JSON representation of a chart would at most be 1024 bytes, and it was generating corrupted JSON output when any chart was exceeding that limit. Removed the limitation (ie. now there is no limit).
-
netdata was crashing while starting, if no usable disks were found.
-
systemd
netdata.servicenow allows setting negative netdata OOM score and restarts netdata if it crashes. The newnetdata.serviceis not automatically installed when updating netdata. Either delete/etc/systemd/system/netdata.serviceand then update/re-install netdata, or copy the file by hand. -
minor fixes at the installer, by @vincele
new plugins
- Added Intel CPU temperature charts on FreeBSD and macOS, by @vlvkobal
- Added CPU thermal throttling charts on Linux (useful on physical servers and possibly laptops)
- Added
chronyplugin, by @domschl - Added Stiebel Eltron plugin to collect metrics from heat pumps and hot water installations from Stiebel Eltron ISG @braindoctor
improved plugins
web_logbugfixes, enhancements and optimizations (includingsquidlogs), by @l2isbadweb_lognow enables parsing HTTP/2 logs incustom_log_format, by @Funzinatorredisbugfixes, by @l2isbadhaproxybugfixes, by @l2isbadelasticsearchbugfixes and optimizations, by @l2isbadrabbitmqbugfixes and optimizations, by @l2isbadmdstatbugfixes, by @JeffHensontomcatimprovements, by @Wing924mysqlimprovements, by @alibo and @l2isbaddovecotimprovementspostgresimprovements, by @facetoecpufreqfixed a bug that preventedaccuratereporting of CPU frequencies.accurateworks with theacpi-cpufreqdriver and calculates the average CPU clock of the CPUs utilizing the accounting per frequency, as reported by the kernel, by @tychocpuidleperformance improvements (faster under load) by @tychofail2banbugfixes, by @l2isbadSNMPplugin new uses latestnet-snmpand the corrupted 64 bit counters encountered under certain node.js version is now fixed.
dashboard improvements
-
easypiechartsandgaugescan now render arbitrary ranges and animate clock wise or counter clock wise. -
traditionally netdata was using 1024 bits = 1 kilobit. It is fixed: 1000 bits = 1 kilobit.
-
netdata charts should now work on wordpress pages.
alarms and notifications
-
alarm-notify.shnow supports debug mode, showing the exact commands it runs to send notifications, whenexport NETDATA_ALARM_NOTIFY_DEBUG=1 -
alarm-notify.shnow supports setting the sender email address of the emails it sends. -
emails sent by
alarm-notify.shnow include headers to reduce the possibility of them being scored as spam, by @Ferroin -
network related alarms got new thresholds and improved badges
-
netdata now detects if the system has been suspended and pauses all alarms for 60 seconds on resume, to prevent false alarms (no more false alarms on laptops when they resume).
-
netdata alarms now support filtering based on hostname and O/S (linux, freebsd, macos). This means that netdata masters, can now support alarms for slaves of any O/S (i.e. a Linux netdata master can handle alarms for a FreeBSD slave).
-
netdata slack notifications now show the host sent the alarm. In the image below, the alarm is about
bangalore, and is sent bynetdata-build-server(at the lower left corner):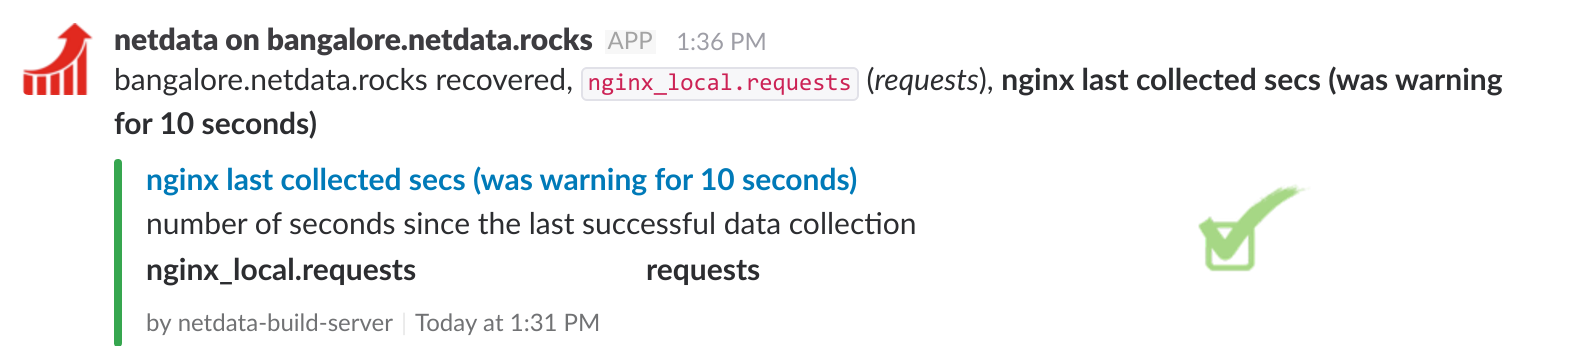
statsd
- the number of fractional points supported by statsd is now configurable (1 to 7).
- 95th percentile calculation on statsd histograms and timers, was incorrectly averaging the values. It is now fixed.
- statsd metrics with non ASCII text were processed by the statsd server, but were breaking JSON data generated by netdata. Fixed it by replacing all invalid characters.
v1.7.0
New to netdata? Check its demo: https://my-netdata.io
This is release v1.7 of netdata.
netdata is still spreading fast: we are at 320.000 users and 132.000 servers! Almost 100k new users, 52k new installations and 800k docker pulls since the previous release 4 and a half months ago! netdata user base grows at about 1000 new users and 600 new servers per day! Thank you! You are awesome!
The next release (v1.8) will be focused on providing a global health monitoring service, for all netdata users, for free! Read more about it here. We need supporters for this cause. Join us!
highlights of netdata v1.7
-
netdata is now a (very fast) fully featured statsd server and the only one with automatic visualization: push a statsd metric and hit F5 on the netdata dashboard: your metric visualized. It also supports synthetic charts, defined by you, so that you can correlate and visualize your application the way you like it.
-
netdata got new installation options - it is now easier than ever to install netdata - we also distribute a statically linked netdata x86_64 binary, including key dependencies (like
bash,curl, etc) that can run everywhere a Linux kernel runs (CoreOS, CirrOS, etc). -
metrics streaming and replication has been improved significantly. All known issues have been solved and key enhancements have been added. headless collectors and proxies can now send metrics to backends when
data source = as collected. -
backends have got quite a few enhancements, including host tags, metrics filtering at the netdata side and sending of chart and dimension names instread of IDs; prometheus support has been re-written to utilize more prometheus features and provide more flexibility and integration options. IF YOU UPDATE FROM NETDATA 1.6 PLEASE CHECK YOUR DASHBOARDS, SINCE MANY METRICS HAVE CHANGED NAMES.
-
netdata now monitors ZFS (on Linux and FreeBSD), ElasticSearch, RabbitMQ, Go applications (via
expvar), ipfw (on FreeBSD 11), samba, squid logs (withweb_logplugin!). -
netdata dashboard loading times have been improved significantly (hit F5 a few times on a netdata dashboard - it is now amazingly fast), to support dashboards with thousands of charts.
-
netdata alarms now support custom hooks, so you can run whatever you like in parallel with netdata alarms.
-
As usual, this release brings dozens more improvements, enhancements and compatibility fixes.
netdata is now a fully featured statsd server
netdata is now a fully featured statsd server. It can collect statsd formatted metrics, visualize them on its dashboards, stream them to other netdata servers or archive them to backend time-series databases.
netdata statsd is fast. It can collect more than 1.200.000 metrics per second on modern hardware, more than 200Mbps of sustained statsd traffic. netdata statsd is inside netdata. This provides a distributed statsd implementation.
netdata also supports statsd synthetic charts: You can create dedicated sections on the dashboard to render the charts. You can control everything: the main menu, the submenus, the charts, the dimensions on each chart, etc.
Read more about netdata statsd
counters
- Scope: count the events of something (e.g. number of file downloads)
- Format:
name:INTEGER|corname:INTEGER|Corname|c - statsd increments the counter by the
INTEGERnumber supplied (positive, or negative).

gauges
- Scope: report the value of something (e.g. cache memory used by the application server)
- Format:
name:FLOAT|g - statsd remembers the last value supplied, and can increment or decrement the latest value if
FLOATbegins with+or-.

histograms
- Scope: statistics on a size of events (e.g. statistics on the sizes of files downloaded)
- Format:
name:FLOAT|h - statsd maintains a list of all the values supplied and provides statistics on them.

The same chart with sum unselected, to show the detail of the dimensions supported:

meters
This is identical to counter.
- Scope: count the events of something (e.g. number of file downloads)
- Format:
name:INTEGER|morname|mor justname - statsd increments the counter by the
INTEGERnumber supplied (positive, or negative).

sets
- Scope: count the unique occurrences of something (e.g. unique filenames downloaded, or unique users that downloaded files)
- Format:
name:TEXT|s - statsd maintains a unique index of all values supplied, and reports the unique entries in it.

timers
- Scope: statistics on the duration of events (e.g. statistics for the duration of file downloads)
- Format:
name:FLOAT|ms - statsd maintains a list of all the values supplied and provides statistics on them.

The same chart with the sum unselected:

dashboard improvements
There have been significant optimizations to the loading times of the dashboard. The dashboard loads instantly now, even when there are several hundreds of charts in it (hit F5 on the dashboard - it is super fast).
For those who know: we eliminated most browser reflows, by refactoring the way the charts are initialized and splitting initialization in 2 phases. Unfortunately we had to re-shape gauge and easypiecharts, so pay some attention to your custom dashboards after updating.
We now use natural sorting on the dashboard elements (i.e. instead of 1, 10, 2, 3 we get 1, 2, 3, 10).
There have been dozens of performance improvements on the netdata dashboard. Like all the previous releases, this release makes netdata the fastest netdata so far!
new installation methods
- Single line installation on Linux
- Static 64bit packages for Linux
- Improved support for Red Hat Enterprise Linux @racciari,
- Improved support for Amazon Machine Image
- Improved support for Centos @n0coast
- Many more installer/updater improvements @nielsAD, @mfurlend
Streaming
- improved self cleanup of obsolete charts and hosts at a central netdata.
- host tags are now propagated from netdata to netdata while streaming metrics.
- log error when multiple clients are streaming the metrics of the same host.
- dozens more streaming improvements and bugfixes.
Backends
- New prometheus backend, supporting all the features of the others backends netdata supports. The new format changed the names of metrics, so if you use grafana or other tools you will have to update your queries.
- Prometheus and opentsdb now support host tags (advanced ephemeral nodes monitoring)
- Metrics sent to backends with data source
average,sumorvolume(from the netdata database) are now more acc...
v1.6.0
New to netdata? Check its demo: https://my-netdata.io


Release announced on twitter, hacker news, reddit r/linux, reddit r/sysadmin, reddit r/linuxadmin, reddit r/freebsd reddit r/devops reddir r/homelab facebook
birthday release: 1 year netdata
netdata was first published on March 30th, 2016.
It has been a crazy year since then:
225.000 unique netdata users
currently, at 1.000 new unique users per day
80.000 unique netdata installations
currently, at 500 new unique installations per day
610.000 docker pulls on docker hub
4.000.000 netdata sessions served
currently, at 15.000 unique netdata sessions served per day
20.000 github stars
Thank you!
You are awesome!
Central netdata is here!
This is the first release that supports real-time streaming of metrics between netdata servers.
netdata can now be:
- autonomous host monitoring (like it always has been)
- headless data collector (collect and stream metrics in real-time to another netdata)
- headless proxy (collect metrics from multiple netdata and stream them to another netdata)
- store and forward proxy (like headless proxy, but with a local database)
- central database (metrics from multiple hosts are aggregated)
metrics databases can be configured on all nodes and each node maintaining a database may have a different retention policy and possibly run (even different) alarms on them.

There are 4 settings that control what netdata can be:
-
[global].memory modeinnetdata.conf, controls if a netdata will maintain a local database and the type of it. For more information check Running a dedicated central netdata server. -
[web].modeinnetdata.conf, controls if netdata will expose its API, and the type of web server to enable (single or multi-threaded). Check netdata.conf configuration for streaming. -
[stream].enabledinstream.conf, controls if netdata will stream its metrics to another netdata. Check stream.conf for sending metrics. -
[API KEY].enabledinstream.conf, controls if netdata will accept metrics from other netdata. Check stream.conf for receiving metrics.
Using the above, we support a lot of different configurations, like these:
| target | memory mode |
web mode |
stream enabled |
send to backend |
local alarms |
local dashboard |
|---|---|---|---|---|---|---|
| headless collector | none |
none |
yes |
not possible | not possible | no |
| headless proxy | none |
not none |
yes |
not possible | not possible | no |
| proxy with db | not none |
not none |
yes |
possible | possible | yes |
| central netdata | not none |
not none |
no |
possible | possible | yes |
monitoring ephemeral nodes
netdata now supports monitoring autoscaled ephemeral nodes, that are started and stopped on demand (their IP is not known).

When the ephemeral nodes start streaming metrics to the central netdata, the central netdata will show register them at my-netdata menu on the dashboard, like this:

You can see this live at https://build.my-netdata.io (this server may not always be available for demo).
For more information check: monitoring ephemeral nodes.
monitoring ephemeral containers and VM guests
netdata now cleans up container, guest VM, network interfaces and mounted disk metrics, disabling automatically their alarms too.
For more information check monitoring ephemeral containers.
apps.plugin ported for FreeBSD
Vladimir Kobal has ported apps.plugin to FreeBSD.
netdata can now provide Applications, Users and User Groups under FreeBSD too:
Also, the CPU utilization of netdata under FreeBSD, is now a lot less compared to netdata v1.5.
See it live at our FreeBSD demo server.
web_log plugin
Ilya Mashchenko has done a wonderful job creating a unified web log parsing plugin for all kinds of web server logs. With it, netdata provides real-time performance information and health monitoring alarms for web applications and web sites!
Requests by http status:

Requests by http status code family:

Requests by http status code:

Requests bandwidth:

Requests timings:

URL patterns of interest (you configure the patterns):

Requests by http method:

Requests by IP version:

Number of unique clients:

and a lot more, including alarms:
| alarm | description | minimum requests |
warning | critical |
|---|---|---|---|---|
1m_redirects |
The ratio of HTTP redirects (3xx except 304) over all the requests, during the last minute. Detects if the site or the web API is suffering from too many or circular redirects. (i.e. oops! this should not redirect clients to itself) |
120/min | > 20% | > 30% |
1m_bad_requests |
The ratio of HTTP bad requests (4xx) over all the requests, during the last minute. Detects if the site or the web API is receiving too many bad requests, including 404, not found.(i.e. oops! a few files were not uploaded) |
120/min | > 30% | > 50% |
1m_internal_errors |
The ratio of HTTP internal server errors (5xx), over all the ... |
v1.5.0
New to netdata? Check its demo: http://my-netdata.io
Release announced on twitter, hacker news, reddit r/linux, reddit r/sysadmin, reddit r/linuxadmin, reddit r/freebsd
Yet another release that makes netdata the fastest netdata ever!
This is probably the release with the largest changeset so far. A lot of work, by a lot of people made this release possible!
FreeBSD, MacOS and FreeNAS
Vladimir Kobal has done a magnificent work porting netdata to FreeBSD and MacOS.
Everything works:
- cpu and interrupts, memory, disks (performance and space monitoring)
- network interfaces and softnet
- IPv4 and IPv6 metrics
- processes and context switches
- IPC (queues, semaphores, shared memory)
- and of course all the netdata external plugins
Wow! Check it live on FreeBSD, at https://freebsd.my-netdata.io/
Backends
netdata supports data archiving to backend databases:
- Graphite
- OpenTSDB
- Prometheus
and of course all the compatible ones (KairosDB, InfluxDB, Blueflood, etc)

With this feature netdata can interface with your existing devops infrastructure and allow you to visualize its metrics with other tools, like grafana.
New Plugins
Ilya Mashchenko has created most of the python data collection plugins in this release! He rocks!
- Systemd Services (real-time monitoring of the resource utilization of all systemd services, using cgroups!)
- FPing (network latency and jitter monitoring with netdata!)
- Postgres databases @facetoe, @MouMouL
- Vanish disk cache (v3 and v4) @l2isbad
- ElasticSearch @l2isbad
- HAproxy @l2isbad
- FreeRadius @l2isbad, @lgz
- mdstat (RAID) @l2isbad
- ISC bind (via rndc) @l2isbad
- ISC dhcpd @l2isbad, @lgz
- Fail2Ban @l2isbad
- OpenVPN status log @l2isbad, @lgz
- NUMA memory @tycho
- CPU Idle States @tycho
- gunicorn @deltaskelta
- ECC memory hardware errors
- IPC semaphores
- uptime ( with a nice badge too:
)
Improved Plugins
- netfilter conntrack
- MySQL/MariaDB (replication) @l2isbad
- ipfs @pjz
- cpufreq @tycho
- hddtemp @l2isbad
- sensors @l2isbad
- nginx @leolovenet
- nginx_log @paulfantom
- phpfpm @leolovenet
- redis @leolovenet
- dovecot @justohall
- cgroups
- disk space
- apps.plugin
- /proc/interrupts @rlefevre
- /proc/softirqs @rlefevre
- /proc/vmstat (system memory charts)
- /proc/net/snmp6 (IPv6 charts)
- /proc/self/meminfo (system memory charts)
- /proc/net/dev (network interfaces)
- tc (linux QoS)
New and Improved Alarms
- MySQL/MariaDB alarms (incl. replication)
- IPFS alarms
- HAproxy alarms
- UDP buffer alarms
- TCP AttemptFails
- ECC memory alarms
- netfilter connections alarms
New Alarm Notification Methods
- messagebird.com @tech-no-logical
- pagerduty.com @jimcooley
- pushbullet.com @tperalta82
- twilio.com @shadycuz
- HipChat
- kafka
Shell Integration
Shell scripts can now query netdata easily!
eval "$(curl -s 'http://localhost:19999/api/v1/allmetrics')"after this command, all the netdata metrics are exposed to shell. Check:
# source the metrics
eval "$(curl -s 'http://localhost:19999/api/v1/allmetrics')"

# let's see if there are variables exposed by netdata for system.cpu
set | grep "^NETDATA_SYSTEM_CPU"

NETDATA_SYSTEM_CPU_GUEST=0
NETDATA_SYSTEM_CPU_GUEST_NICE=0
NETDATA_SYSTEM_CPU_IDLE=95
NETDATA_SYSTEM_CPU_IOWAIT=0
NETDATA_SYSTEM_CPU_IRQ=0
NETDATA_SYSTEM_CPU_NICE=0
NETDATA_SYSTEM_CPU_SOFTIRQ=0
NETDATA_SYSTEM_CPU_STEAL=0
NETDATA_SYSTEM_CPU_SYSTEM=1
NETDATA_SYSTEM_CPU_USER=4
NETDATA_SYSTEM_CPU_VISIBLETOTAL=5

# let's see the total cpu utilization of the system
echo ${NETDATA_SYSTEM_CPU_VISIBLETOTAL}
5

# what about alarms?
set | grep "^NETDATA_ALARM_SYSTEM_SWAP_"
NETDATA_ALARM_SYSTEM_SWAP_RAM_IN_SWAP_STATUS=CRITICAL
NETDATA_ALARM_SYSTEM_SWAP_RAM_IN_SWAP_VALUE=53
NETDATA_ALARM_SYSTEM_SWAP_USED_SWAP_STATUS=CLEAR
NETDATA_ALARM_SYSTEM_SWAP_USED_SWAP_VALUE=51

# let's get the current status of the alarm 'ram in swap'
echo ${NETDATA_ALARM_SYSTEM_SWAP_RAM_IN_SWAP_STATUS}
CRITICAL

# is it fast?
time curl -s 'http://localhost:19999/api/v1/allmetrics' >/dev/null

real  0m0,070s
user  0m0,000s
sys   0m0,007s

# it is...
# 0.07 seconds for curl to be loaded, connect to netdata and fetch the response back...
The _VISIBLETOTAL variable sums up all the dimensions of each chart.
The format of the variables is:
NETDATA_${chart_id^^}_${dimension_id^^}="${value}"
The value is rounded to the closest integer, since shell script cannot process decimal numbers.
Dashboard Improvements
- dashboard is now faster on firefox, safari, opera, edge (edge is still the slowest)
- dashboard charts legends now have bigger fonts
- SHIFT + mousewheel to zoom charts, works on all browsers
- perfect-scrollbar on the dashboard
- dashboard 4K resolution fixes
- dashboard compatibility fixes for embedding charts in third party web sites
- charts on custom dashboards can have common min/max even if they come from different netdata servers
- alarm log is now saved and loaded back so that the alarm history is available at the dashboard
Other Improvements
- python.d.plugin has received way to many improvements from many contributors!
- charts.d.plugin can now be forked to support multiple independent instances
- registry has been re-factored to lower its memory requirements (required for the public registry)
- simple patterns in cgroups, disks and alarms
- netdata-installer.sh can now correctly install netdata in containers
- supplied logrotate script compatibility fixes
- spec cleanup @breed808
- clocks and timers reworked @rlefevre
netdata has received a lot more improvements from many more contributors! (it was really a lot of work to dig into git log to collect all the above, so forgive me if I forgot to mention a few contributions and contributors).
Thank you all!
v1.4.0
New to netdata? Check its demo: http://my-netdata.io
Release announced on Hacker News
Release announced on reddit r/linux
Release announced on reddit r/sysadmin
Release announced on twitter
At a glance
- the fastest netdata ever (with a better look too)!
- improved IoT and containers support!
- alarms improved in almost every way!
- new plugins:
- softnet netdev,
- extended TCP metrics,
- UDPLite
- NFS v2, v3 client (server was there already),
- NFS v4 server & client,
- APCUPSd,
- RetroShare
- improved plugins:
- mysql,
- cgroups,
- hddtemp,
- sensors,
- phpfm,
- tc (QoS)
In detail
improved alarms!
Many new alarms have been added to detect common kernel configuration errors and old alarms have been re-worked to avoid notification floods.
Alarms now support:
-
notification hysteresis (both static and dynamic)

-
notification self-cancellation, and
-
dynamic thresholds based on current alarm status

Also, a new alarms log:

improved alarm notifications
netdata now supports:
- email notifications
- slack.com notifications on slack channels
- pushover.net notifications (mobile push notifications)
- telegram.org notifications
For all the above methods, netdata supports role-based notifications, with multiple recipients for each role and severity filtering per recipient!
Also, netdata support HTML5 notifications, while the dashboard is open in a browser window (no need to be the active one).

All notifications (HTML5, emails, slack, pushover, telegram) are now clickable to get to the chart that raised the alarm.
other improvements
-
improved IoT support!
netdata builds and runs with musl libc and runs on systems based on busybox.
-
improved containers support!
netdata runs on alpine linux (a low profile linux distribution used in containers).
-
Dozens of other improvements and bugfixes
netdata 1.4.0 - download release tarfiles from http://firehol.org/download/netdata/releases/v1.4.0
v1.3.0
New to netdata? Check its demo: http://my-netdata.io
At a glance
- netdata has health monitoring / alarms!
- netdata generates badges that can be embeded anywhere!
- netdata plugins are now written in python!
- new plugins: redis, memcached, nginx_log, ipfs, apache_cache
IMPORTANT:
Since netdata now uses python plugins, new packages are
required to be installed on a system to allow it work.
For more information, please check the installation page.
In detail
netdata has alarms!
Based on the POLL we made on github, health monitoring was the winner. So here it is!
netdata now has a powerful health monitoring system embedded.

netdata has badges!
netdata can generate badges with live information from the collected metrics.
netdata plugins are now written in python!
Thanks to the great work of Paweł Krupa (@paulfantom), most BASH plugins have been ported to python.
The new python.d.plugin supports both python2 and python3 and data collection from multiple sources for all modules.
The following pre-existing modules have been ported to python:
- apache
- cpufreq
- example
- exim
- hddtemp
- mysql
- nginx
- phpfm
- postfix
- sensors
- squid
- tomcat
The following new modules have been added:
- apache_cache
- dovecot
- ipfs
- memcached
- nginx_log
- redis
other data collectors
Thanks to @simonnagl netdata now reports disk space usage.
other improvements
-
dashboards now transfer certain settings from server to server when changing servers via the my-netdata menu.
The settings transferred are the dashboard theme, the online help status and current pan and zoom timeframe of the dashboard.
-
API improvements:
- reduction functions now support 'min', 'sum' and 'incremental-sum'.
- netdata now offers a multi-threaded and a single threaded web server (single threaded is better for IoT).
-
apps.plugin improvements:
- can now run with command line argument 'without-files' to prevent it from enumating all the open files/sockets/pipes of all running processes.
- apps.plugin now scales the collected values to match the
the total system usage. - apps.plugin can now report guest CPU usage per process.
- repeating errors are now logged once per process.
-
netdata now runs with IDLE process priority (lower than nice 19)
-
netdata now instructs the kernel to kill it first when it starves for memory.
-
netdata listens for signals:
- SIGHUP to netdata instructs it to re-open its log files (new logrotate file added too).
- SIGUSR1 to netdata saves the database
- SIGUSR2 to netdata reloads health / alarms configuration
-
netdata can now bind to multiple IPs and ports.
-
netdata now has new systemd service file (it starts as user netdata and does not fork).
-
Dozens of other improvements and bugfixes
netdata 1.3.0 - download release tarfiles from http://firehol.org/download/netdata/releases/v1.3.0