It's a program that allows to design graphs, step through algorithms and gain insight into their internal state. It helps to understand the working principles of graph algorithms. Graph colouring and visual representation of data objects is used to make it as intuitive as possible.
- assist teaching
- serve as stand-alone learning tool (so accompanying verbal explanation is not required)
- consolidate understanding by observing algorithms behaviour on custom graphs
Download and unpack release.zip, then run "graph_algorithms_tool.exe" file.
It was created for CE301 Capstone Project module, based on the Project Choices Database proposal by Dr. Michael Sanderson:
The aim of this project is to implement a tool to assist with the teaching of graph algorithms such as those taught in CE204.
It should provide a graphical display of step-by-step implementation of the algorithms with accompanying descriptive text. This should be offered at various levels of abstraction (e.g. for Kruskal's algorithm a version showing the connection sets and a more abstract version that uses the concept of not forming a cycle). It should be able to work on arbitrary graphs (i.e. the descriptions should not be based on a particular graph).
Ideally there should also be a graphical user interface that allows the user to create graphs by adding nodes at points on the display and creating edges to connect them, allowing the user's chosen graph to be used to demonstrate the algorithm.
The docs directory contains the following:
- Final report / dissertation
- Project introduction Word document, which includes write-ups about objectives, background reading and project management
- features_documentation.md file, which demonstrates implemented functionality of the program
- implementation_report.md file, which describes how the program was implemented, what technology and design patterns were used
- project_management.md file, where I addressed planning, organisation, risk management and use of project management tools like Jira and Gitlab
- program_controls.md file, which lists actions and corresponding keyboard/mouse controls
- testing_report.md file, which describes what kind of testing was undertaken and for what purposes
- academic poster
Right arrow button proceeds to the next step of algorithm. Colouring is used to signify nodes/edges of the graph. Where applicable changes are marked using orange colour (e.g. in collection items, or on the graph itself). For all algorithms except Kruskals, the user can select the starting node by clicking on it. It is also possible to reset the algorithm mid-run by pressing escape. Graph modification is partially disabled after making the first algorithm step, nodes can be moved, but they can't be added or removed, edge weights also cannot be changed (because such changes would disrupt algorithms integrity).
As the algorithm progresses, added edges form multiple sub-graphs that are marked using different colours. Additionally, the root node of each sub-graph is marked with violet colour which gets reverted to default when sub-graph is merged into another sub-graph (by newly added edge).
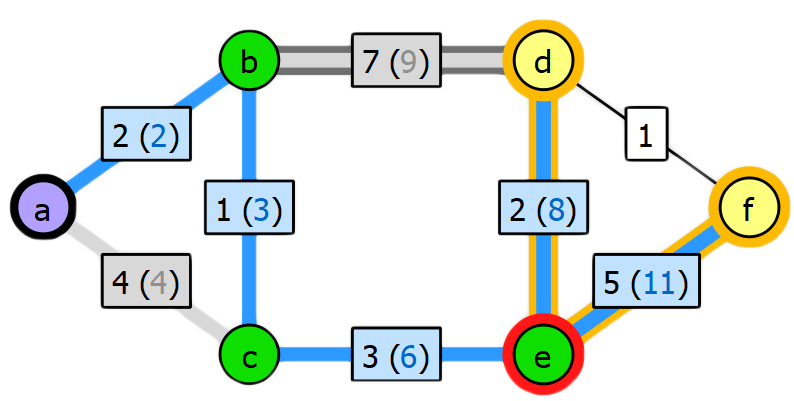
As the algorithm progresses, edges that are part of current optimal paths get assigned total distance (blue coloured value inside brackets) from starting node.
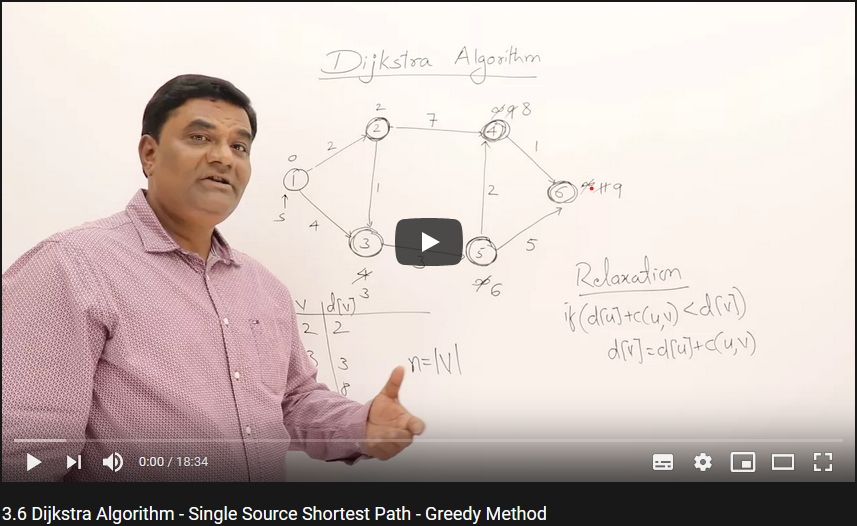
If the "Use suggested graphs" checkbox is checked then the graph is set to the one used by Dr. Abdul Bari in his Dijkstra algorithm video. Having only 6 nodes, it performs "relaxation" 3 times in total (not counting the initial nodes set to INT_MAX), which can be seen on animation below (previously blue edges turn gray because they're no longer optimal).
Similarily to DFS, the weights of edges become hidden when BFS is selected. As the algorithm progresses, the edge weights get assigned distance from the root node.
Similarily to BFS, the weights of edges become hidden when DFS is selected. As the algorithm progresses, the edge weights get assigned distance from the root node.
Michal Borowski
Student ID: 1904535