Docker compose file for InfluxDB OSS version, also useful for Prometheus long-term storage.
See https://github.com/swarmstack/victoria-metrics for highly performant time-series database that can be used for Prometheus metrics long-term storage, uses signficantly less RAM and supports higher-cardinality time-series data than the OSS version of InfluxDB.
INFLUXDB_ADMIN_USER='admin' \
INFLUXDB_ADMIN_PASSWORD='admin' \
INFLUXDB_USER='prometheus' \
INFLUXDB_USER_PASSWORD='prompass' \
docker stack deploy -c docker-compose.yml influxdb
Or you can take some or all of the defaults above:
docker stack deploy -c docker-compose.yml influxdb
swarmstack users should use docker-compose-swarmstack.yml instead.
Add remote-write and remote-read stanzas to your Prometheus configuration in order to use InfluxDB to store Prometheus metrics longer-term. swarmstack users can add the below to localswarmstack/prometheus/conf/prometheus.yml, otherwise just substitute http://influxdb with your Influx address:
alerting:
  alertmanagers:
  - static_configs:
    - targets: [ 'alertmanager:9093', 'alertmanagerB:9093' ]

remote_write:
  - url: "http://influxdb:8086/api/v1/prom/write?db=prometheus&u=prometheus&p=prompass"

remote_read:
  - url: "http://influxdb:8086/api/v1/prom/read?db=prometheus&u=prometheus&p=prompass"
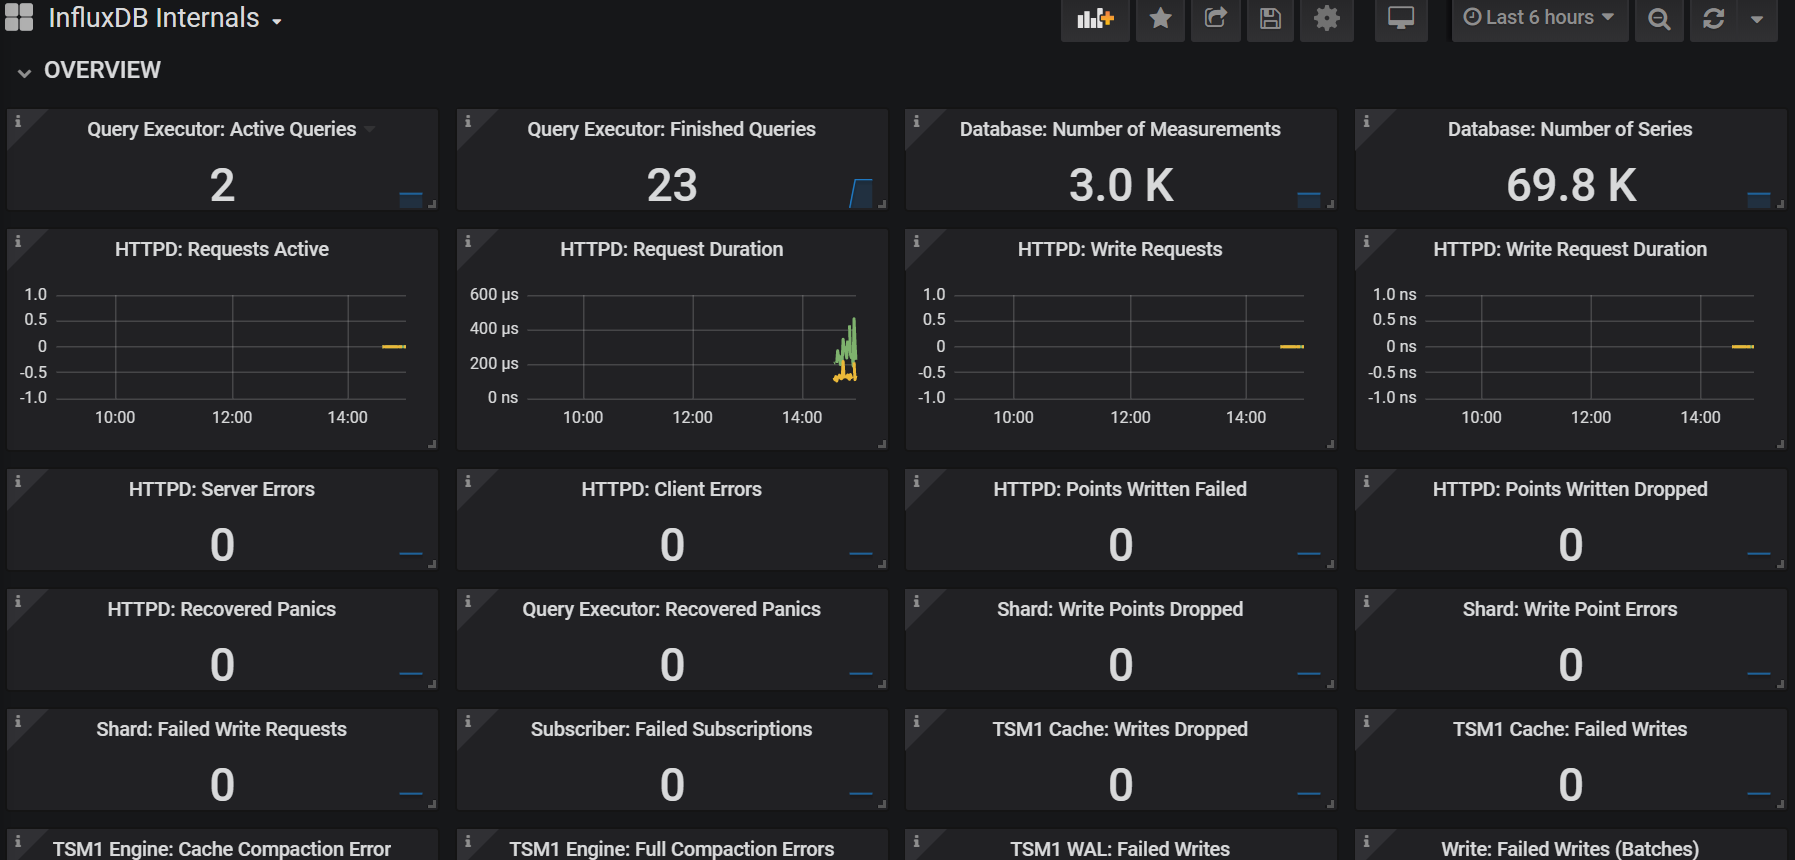
A dashboard which nicely visualizes all 'internal' Grafana OSS metrics documented at InfluxData.com and exported via influxdb_stats_exporter into Prometheus.
