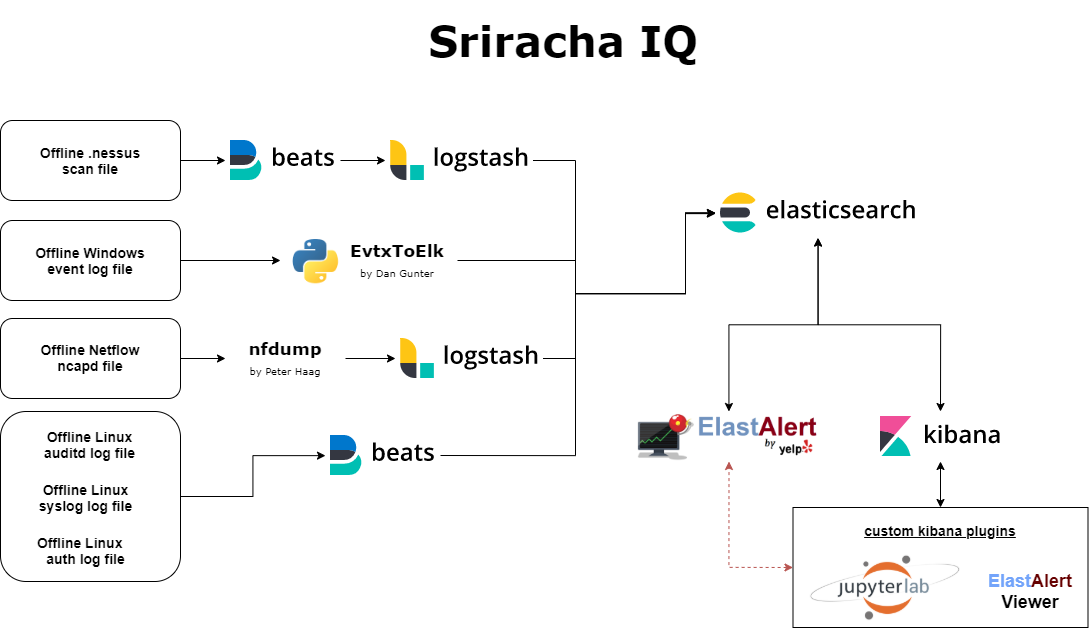
This project is an instantiation of the Elastic Stack for the purposes of assessing system security and perofrming audits, a task commonly associated with independent blue teams, threat hunters, security control assessors, and cyber security auditors. It facilitates aggregation and analysis of commonly used log formats to include event logs (Windows & Linux) and vulnerability scanner logs, with more coming soon.
This tool was designed with the basic assumption that some central aggregation isn't already in place in the target environment & that the rules of engagement preclude installation of instrumentation (i.e. sysmon, filebeats, nxlog, rsyslog, nessus agents, etc...). As a result, the modus operandi requires manual extraction of logs & offline analysis, which is a difficult task that can be time consuming. This is a pretty common situation for independent assessors that aren't traditionally associated with the target environment being assessed. This project aims to aid in these types of scenarios by leveraging Elastic for centralization of this data, including ingestion processes for offline data and Kibana dashboards for visualizing & analyzing the data quickly to deliver quick assessments of the target environments.
Given this, the project is built in Docker, leveraging docker-compose, facilitating quick environments for building, data ingestion, analysis, and destruction. As a result, security features within Elastic are minimal as the service isn't intended to be public facing nor long running - it is intended to be run on either an analysis workstation or private server with limited access. Again, do not expose the Elastic components hosted on this system to neither the open internet nor a corporate/enterprise environment.
Fully built leveraging docker-compose, so basic docker-compose proficiency required to utilize this toolkit.
-
Ensure docker daemon & docker-compose installed on system
-
Clone repository to target directory
-
Navigate to target directory
docker-compose build docker-compose up -d -
Verify status of containers, takes about 5 minutes to fully start up required services
 docker-compose ps
 docker-compose logs -f
Features I'd like to eventually implement:
- Kibana Plugin Linking to Jupyter Labs
- Kibana Plugin for viewing ElastaAlerts
- Maybe add functionality for marking alerts viewed / acknowledged / completed??
- Demonstrate integration with triage data collection tool, like KAPE. Maybe even write a custom KAPE collection YAML file to include with prject
- Plaso Integration?
- nmap integration
- network config ingest - could be used to find bad settings (i.e. no portsec) and maybe even for rudimentary physical mapping
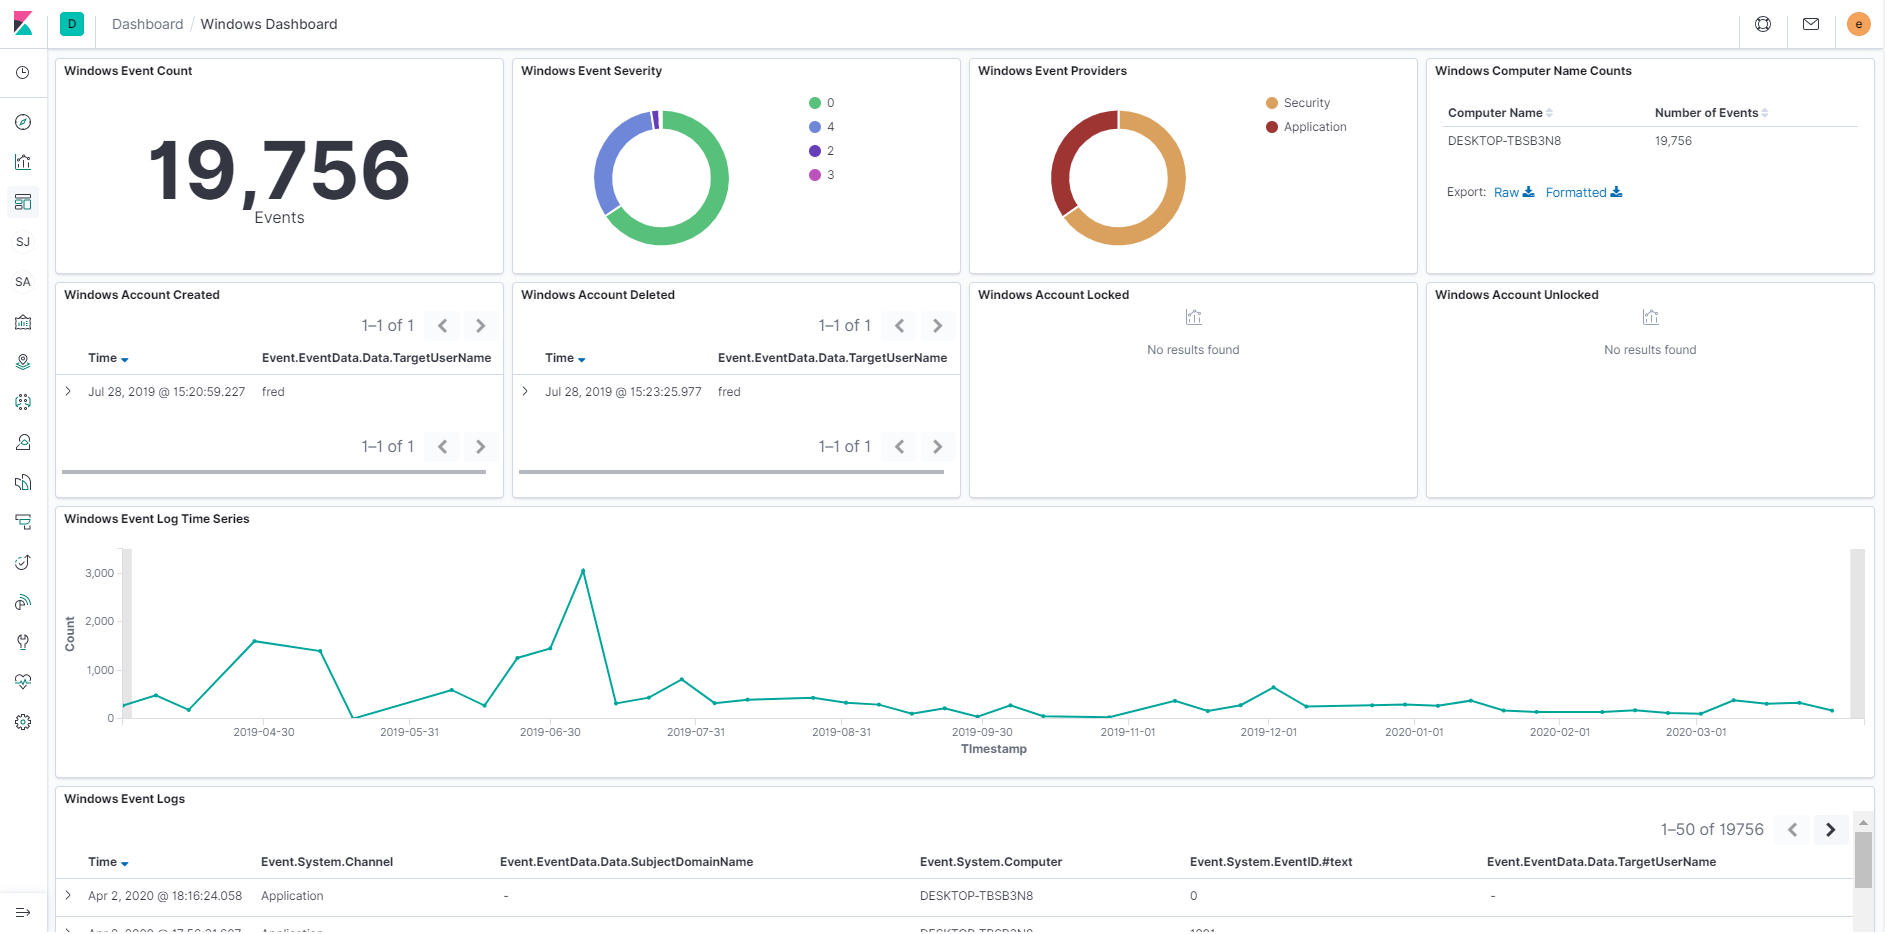
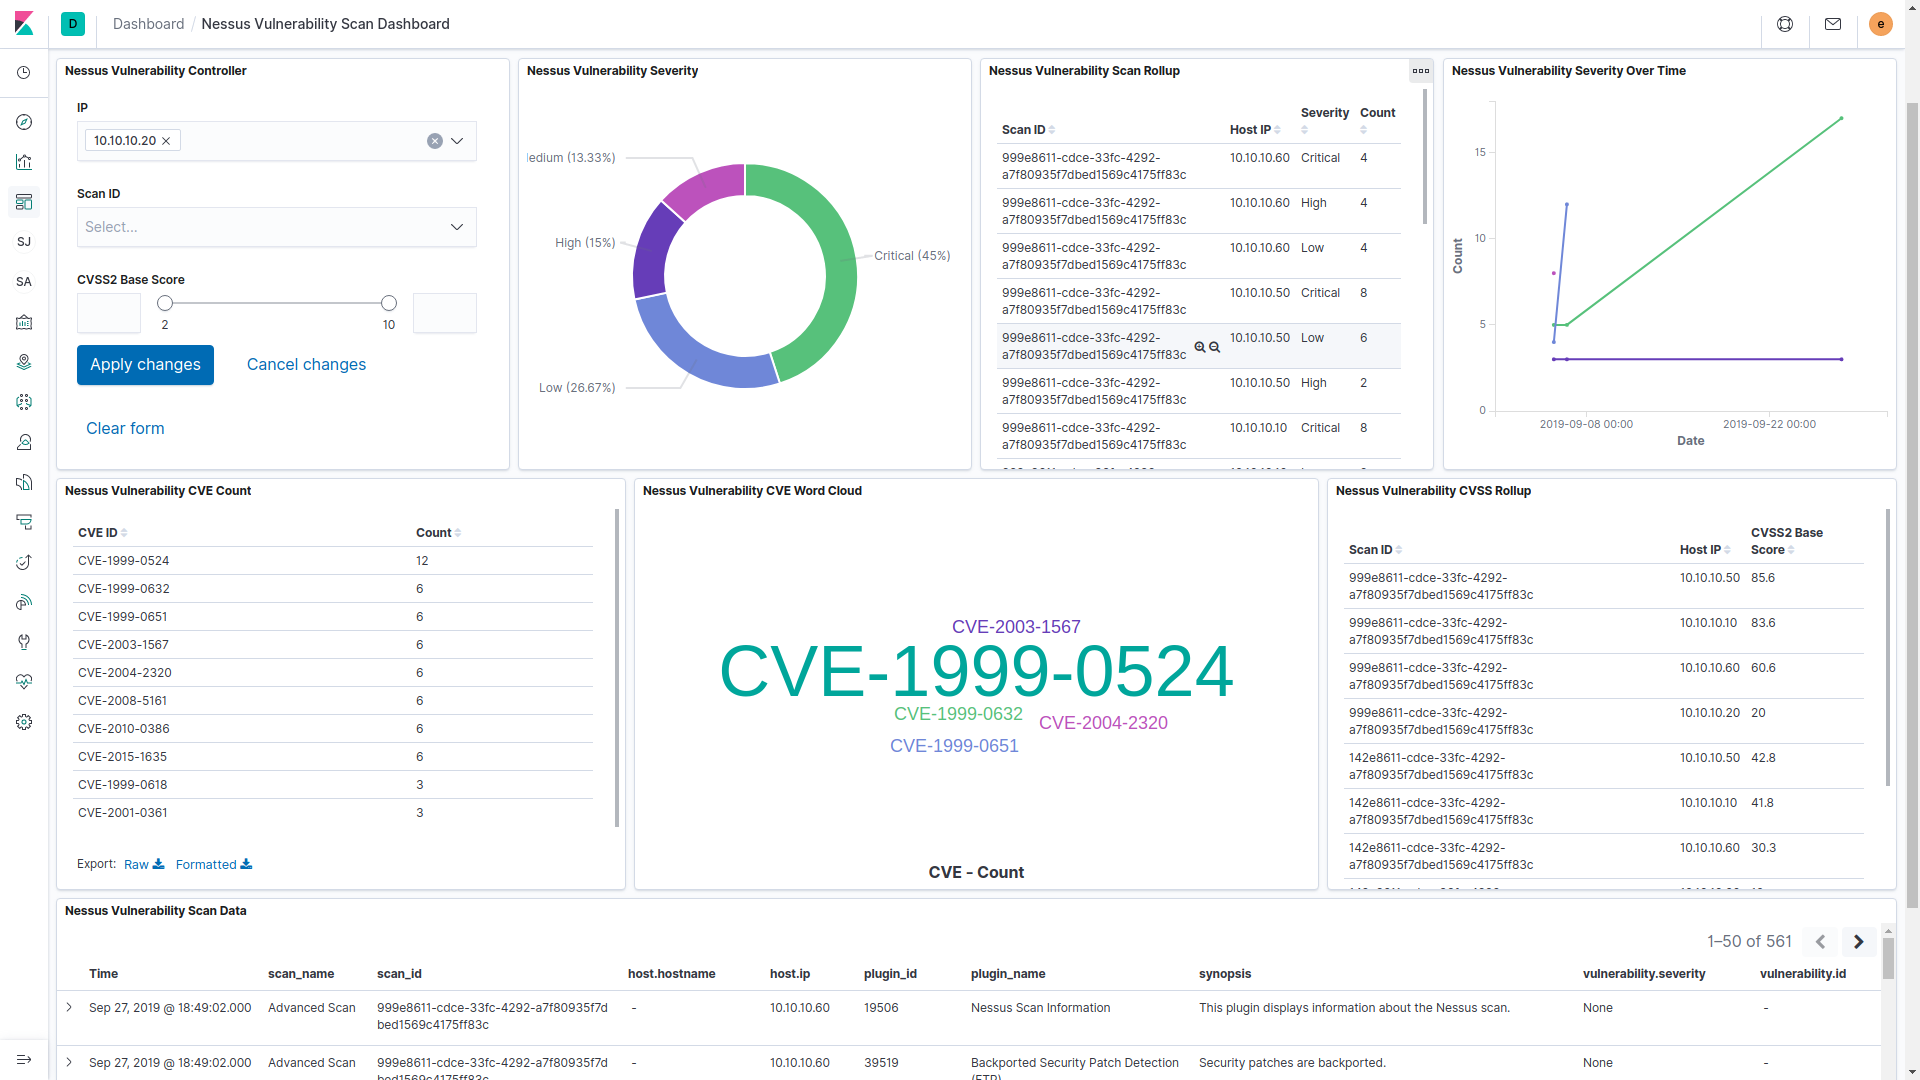
To use Kibana, access port 80 which is exposed to the docker host. A variety of views, filters, dashboards, and visualizations are preconfigured and installed as part of the SrirachaIQ suite.
Application URL:
The following Kibana dashboards are bundled into the project for viewing and visualization ingested log data.
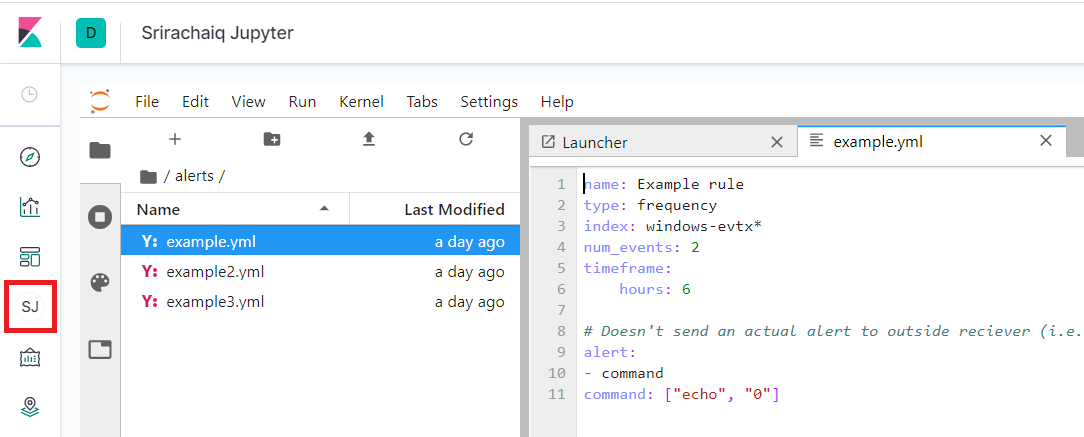
For more advanced usage & custom analytics, Jupyter Notebooks have been integrated into the environment. The installation comes with basic elasticsearch libraries included & an example is included. The Jupyter Lab environment is exposed to the docker host over port 8888.
Persistent Notebooks Location (survives docker containers being destroyed):
- notebooks
Accesible via Kibana Plugin:
Or directly via the application URL:
ElastAlert is a project for creating detections in YAML & alerting via a variety of methods including via a Kibana index, email, slack, & Jira. Alert YAML definitions can be created and inserted into ./alerts folder and they will automatically be enabled. They can also be created via Juptyer Lab; the alerts folder is automatically mounted. For testing rules, exec into the container (docker-compose exec elastalert /bin/bash) and use the standard elastalert test command (elastalert-test-rule --config /app/config.yml /alerts/example.yml); the alerts folder is mounted to /alert.
Elastalert isn't really meant to be used on static datasets with older data, but rather is designed for live streams of data. To make it work in our use case, we set a huge buffer_time which makes it run over a long period of time & realert to 0, so each match in the buffer_time generates its own alert:
buffer_time:
  weeks: 52
realert:
  minutes: 0
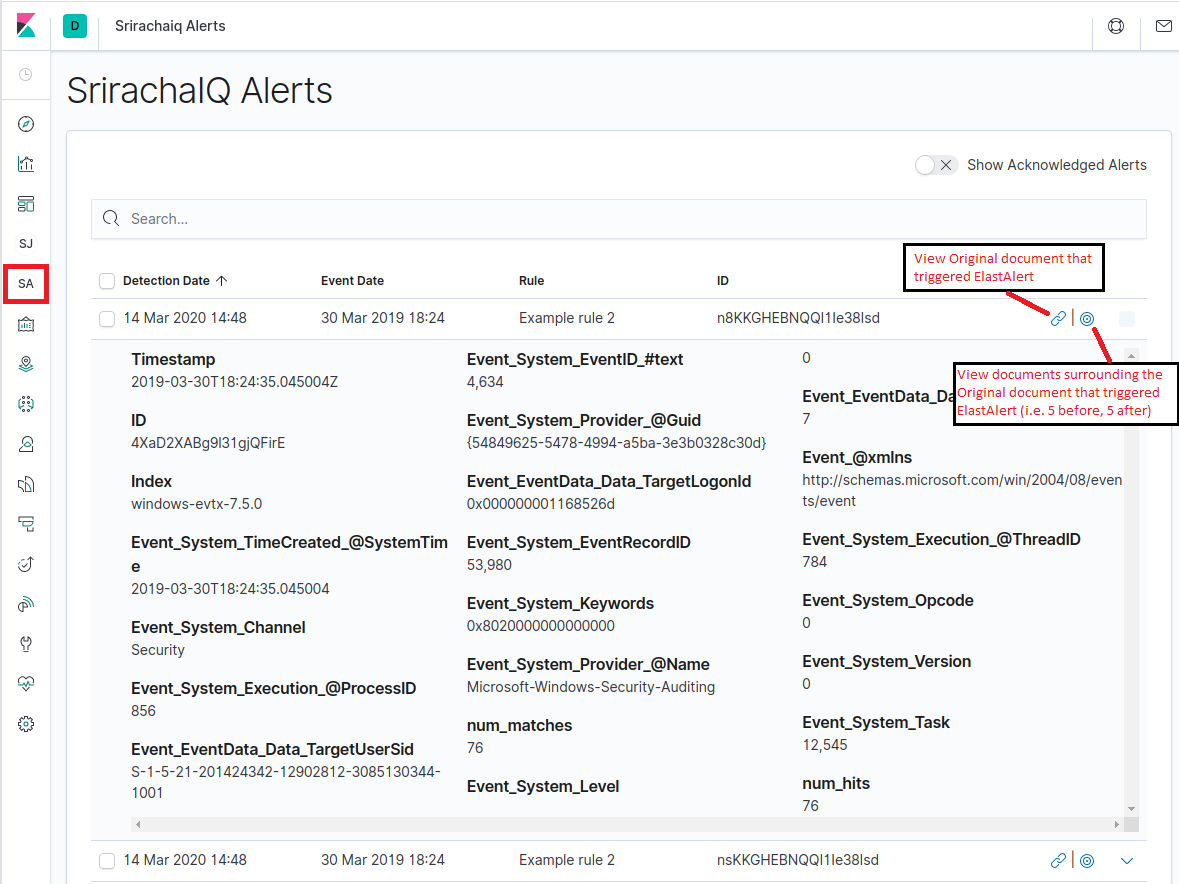
A custom Kibana plugin is included for viewing alerts generated by ElastaAlert and acknowledging that they've been reviewed/completed:
As discussed in the Overview, the assumption is that we are working with data obtained manually & not via some centralized repository, for example manual extraction of evtx files for a Windows endpoint or manual download of the XML-based vulnerability scan report from nessus
Windows XML Event Logs
Windows Vista +, Server 2008 +:
- C:\Windows\System32\winevt\Logs\[Application, Software, Security, etc.]
Note: On many falvors of Linux, if you just retrieve logs from the system directly, since the assumption is you can't just point rsyslog to you own collector, the year is ommited in the timestamps. This causes the ingest modules to just assume the current year, which in some cases could end up with events showing up in the future. For example, if the current date is Jan 18th 2020, and the log was retrieved December 1st 2019, the ingested events would show up as various dates in December 2020. If this is an issue for your analysis, there is a quick & dirty Python script for adding years to a log included in /misc/linux_logs_add_year.py; the script is compatible with Python 2.7+.
Sample Usage:
cat /var/log/secure.log | python linux_logs_add_year.py 2019 > /tmp/auth_log_with_year.log
Generic system activity logs
RHEL Based Linux:
- /var/log/messages*

Debian Based Linux:
- /var/log/syslog*
Authentication related event logs
RHEL Based Linux:
- /var/log/secure*

Debian Based Linux:
- /var/log/auth.log*
Audit daemon logs
RHEL & Debian Based Linux:
/var/log/audit/audit.log*
Nessus vulnerability scan data
All versions:
Export .nessus XML file from Security Center or Nessus
Netflow records
All nfcapd binary files supported by nfdump