Releases: netdata/netdata
v1.40.1
Netdata v1.40.1 is a patch release to address issues discovered since v1.40.0.
This patch release provides the following bug fixes:
- Fixed ebpf sync thread crash (#15174, thiagoftsm).
- Fixed ebpf threads taking too long to terminate (#15187, thiagoftsm).
- Fixed building with eBPF on RPM systems due to missing build dependency (#15192, k0ste).
- Fixed building on macOS due to incorrect include directive (#15195, nandahkrishna).
- Fixed a crash during health log entry processing (#15209, stelfrag).
- Fixed architecture detection on i386 when building native packages (#15218, ilyam8).
- Fixed SSL non-blocking retry handling in the web server (#15222, ktsaou).
- Fixed handling of plugin ownership in static builds (#15230, Ferroin).
- Fixed an exception in python.d/nvidia_smi due to not handling N/A value (#15231, ilyam8).
- Fixed installing the wrong systemd unit file on older RPM systems (#15240, Ferroin).
- Fixed creation of charts for network interfaces of virtual machines/containers as normal network interface charts (#15244, ilyam8).
- Fixed building on openSUSE Leap 15.4 due to incorrect $(libh2o_dir) expansion (#15253, Dim-P).
Acknowledgements
We would like to thank our dedicated, talented contributors that make up this amazing community. The time and expertise
that you volunteer are essential to our success. We thank you and look forward to continuing to grow together to build a
remarkable product.
- @k0ste for fixing building with eBPF on RPM systems.
- @nandahkrishna for fixing building on macOS.
Support options
As we grow, we stay committed to providing the best support ever seen from an open-source solution. Should you encounter
an issue with any of the changes made in this release or any feature in the Netdata Agent, feel free to contact us
through one of the following channels:
- Netdata Learn: Find documentation, guides, and reference material for monitoring and troubleshooting your systems with Netdata.
- GitHub Issues: Make use of the Netdata repository to report bugs or open a new feature request.
- GitHub Discussions: Join the conversation around the Netdata development process and be a part of it.
- Community Forums: Visit the Community Forums and contribute to the collaborative knowledge base.
- Discord Server: Jump into the Netdata Discord and hang out with like-minded sysadmins, DevOps, SREs, and other troubleshooters. More than 1400 engineers are already using it!
Contributors
Assets 15
v1.40.0
- Netdata Growth
- Release Highlights
- Dashboard Sections' Summary Tiles
Added summary tiles to most sections of the fully-automated dashboards, to provide an instant view of the most important metrics for each section. - Silencing of Cloud Alert Notifications
Maintenance window coming up? Active issue being checked? Use the Alert notification silencing engine to mute your notifications. - Machine Learning - Extended Training to 24 Hours
Netdata now trains multiple models per metric, to learn the behavior of each metric for the last 24 hours. Trained models are persisted on disk and are loaded back on Netdata restart. - Rewritten SSL Support for the Agent
Netdata Agent now features a new SSL layer that allows it to reliably use SSL on all its features, including the API and Streaming.
- Dashboard Sections' Summary Tiles
- Alerts and Notifications
- Visualizations / Charts and Dashboards
- Preliminary steps to split native packages
- Acknowledgements
- Contributions
- Deprecation notice
- Cloud recommended version
- Release meetup
- Support options
- Running survey
Netdata Growth
🚀 Our community growth is increasing steadily. ❤️ Thank you! Your love and acceptance give us the energy and passion to work harder to simplify and make monitoring easier, more effective and more fun to use.
- Over 63,000 GitHub Stars ⭐
- Over 1.5 million online nodes
- Almost 94 million sessions served
- Over 600 thousand total nodes in Netdata Cloud
Wow! Netdata Cloud is about to become the biggest and most scalable monitoring infra ever created!
Let the world know you love Netdata.
Give Netdata a ⭐ on GitHub now.
Motivate us to keep pushing forward!
Unlimited Docker Hub Pulls!
To help our community use Netdata more broadly, we just signed an agreement with Docker for the purchase of Rate Limit Removal, which will remove all Docker Hub pull limits for the Netdata repos at Docker Hub. We expect this add-on to be applied to our repos in the following few days, so that you will enjoy unlimited Docker Hub pulls of Netdata Docker images for free!
Release Highlights
Dashboard Sections' Summary Tiles
Netdata Cloud dashboards have been improved to provide instant summary tiles for most of their sections. This includes system overview, disks, network interfaces, memory, mysql, postgresql, nginx, apache, and dozens more.
To accomplish this, we extended the query engine of Netdata to support multiple grouping passes, so that queries like "sum metrics by label X, and then average by node" are now possible. At the same time we made room for presenting anomaly rates on them (vertical purple bar on the right) and significantly improved the tile placement algorithm to support multi-line summary headers and precise sizing and positioning, providing a look and feel like this:

The following chart tile types have been added:
- Donut

- Gauge

- Bar

- Trendline

- Number

- Pie chart

To improve the efficiency of using these tiles, each of these tiles supports the following interactive actions:
- Clicking the title of the tile scroll the dashboard to the data source chart, where you can slice, dice and filter the data based on which the tile was created.
- Hovering the tile with your mouse pointer, the NIDL (Nodes, Instances, Dimensions, Labels) framework buttons appear, allowing you to explore and filter the data set, right on the tile.
Some examples that you can see from the Netdata Demo space:
Silencing of Cloud Alert Notifications
Although Netdata Agent alerts support silencing, centrally dispatched alert notifications from Netdata Cloud were missing that feature. Today, we release alert notifications silencing rules for Netdata Cloud!
Silencing rules are applied on any combination of the following: users, rooms, nodes, host labels, contexts (charts), alert name, alert role. For the matching alerts, silencing can optionally have a starting date and time and/or an ending date time.
With this feature you can now easily setup silencing rules, which can be set to be applied immediately or at a defined schedule, allowing you to plan for upcoming schedule maintenance windows - see some examples here.

Read more about Silencing Alert notifications on our documentation.
Machine Learning - Extended Training to 24 Hours
Netdata trains ML models for each metric, using its past data. This allows Netdata to detect anomalous behaviors in metrics, based exclusively on the recent past data of the metric itself.
Before this release Netdata was training one model of each metric, learning the behavior of each metric during the last 4 hours. In the previous release we introduced persisting these models to disk and loading them back when Netdata restarts.
In this release we change the default ML settings to support multiple models per metric, maintaining multiple trained models per metric, covering the behavior of each metric for last 24 hours. All these models are now consulted automatically in order to decide if a data collection point is anomalous or not.
This has been implemented in a way to avoid introducing additional CPU overhead on Netdata agents. So, instead of training one model for 24 hours which would introduce significant query overhead on the server, we train each metric every 3 hours using the last 6 hours of data, and we keep 9 models per metric. The most recent model is consulted first during anomaly detection. Addi...
v1.39.1
This patch release provides the following bug fixes:
-
We noticed that claiming and enabling auto-updates have been failing due to incorrect permissions when
kickstart.shwas doing a static installation. The issue has affected all static installations, including the one done from the Windows MSI installer. The permissions have now been corrected. -
The recipient lists of agent alert notifications are configurable via the
health_alarm_notify.conffile. A stock file with default configurations can be modified usingedit-config. @jamgregory noticed that the default settings in that file can make changing role recipients confusing. Unless the edited configuration file included every setting of the original stock file, the resulting behavior was unintuitive. @jamgregory kindly added a PR to fix the handling of custom role recipient configurations. -
A bug in our collection and reporting of Infiniband bandwidth was discovered and fixed.
-
We noticed memory buffer overflows under some very specific conditions. We adjusted the relevant buffers and the calls to
strncpyzto prevent such overflows. -
A memory leak in certain circumstances was found in the ACLK code. We fixed the the incorrect data handling that caused it.
-
An unrelated memory leak was discovered in the ACLK code and has also been fixed.
-
Exposing the anomaly rate right on top of each chart in Netdata Cloud surfaced an issue of bad ML models on some very noisy metrics. We addressed the issue by suppressing the indications that these noisy metrics would produce. This change gives the ML model a chance to improve, based on additional collected data.
-
Finally, we improved the handling of errors during ML transactions, so that transactions are properly rolled back, instead of failing in the middle.
Support options
As we grow, we stay committed to providing the best support ever seen from an open-source solution. Should you encounter
an issue with any of the changes made in this release or any feature in the Netdata Agent, feel free to contact us
through one of the following channels:
- Netdata Learn: Find documentation, guides, and reference material for monitoring and
troubleshooting your systems with Netdata. - GitHub Issues: Make use of the Netdata repository to report bugs or open
a new feature request. - GitHub Discussions: Join the conversation around the Netdata
development process and be a part of it. - Community Forums: Visit the Community Forums and contribute to the collaborative
knowledge base. - Discord: Jump into the Netdata Discord and hangout with like-minded sysadmins,
DevOps, SREs and other troubleshooters. More than 1300 engineers are already using it!
v1.39.0
- Netdata open-source growth
- Release highlights
- Netdata Charts v3.0
A new era for monitoring charts. Powerful, fast, easy to use. Instantly understand the dataset behind any chart. Slice, dice, filter and pivot the data in any way possible! - Windows support
Windows hosts are now first-class citizens. You can now enjoy out-of-the-box monitoring of over 200 metrics from your Windows systems and the services that run on them. - Virtual nodes and custom labels
You now have access to more monitoring superpowers for managing medium to large infrastructures. With custom labels and virtual hosts, you can easily organize your infrastructure and ensure that troubleshooting is more efficient. - Major upcoming changes
Separate packages for data collection plugins, mandatoryzlib, no upgrades of existing installs from versions prior to v1.11. - Bar charts for functions
- Opsgenie notifications for Business Plan users
Business plan users can now seamlessly integrate Netdata with their Atlassian Opsgenie alerting and on call management system.
- Netdata Charts v3.0
- Data Collection
- Containers and VMs CGROUPS
- Docker
- Kubernetes
- Kernel traces/metrics eBPF
- Disk Space Monitoring
- OS Provided Metrics proc.plugin
- PostgreSQL
- DNS Query
- HTTP endpoint check
- Elasticsearch and OpenSearch
- Dnsmasq DNS Forwarder
- Envoy
- Files and directories
- RabbitMQ
- charts.d.plugin
- Anomalies
- Generic structured data with Pandas
- Generic Prometheus collector
- Alerts and Notifications
- Visualizations / Charts and Dashboards
- Machine Learning
- Installation and Packaging
- Administration
- Documentation and Demos
- Deprecation notice
- Netdata Agent Release Meetup
- Support options
- Running survey
- Acknowledgements
Netdata open-source growth
- Over 62,000 GitHub Stars
- Over 1.5 million online nodes
- Almost 92 million sessions served
- Over 600 thousand total nodes in Netdata Cloud
Release highlights
Netdata Charts v3.0
We are excited to announce Netdata Charts v3.0 and the NIDL framework. These are currently available at Netdata Cloud. At the next Netdata release, the agent dashboard will be replaced to also use the same charts.
One of the key obstacles in understanding an infrastructure and troubleshooting issues, is making sense of the data we see on charts. Most monitoring solutions assume that the users have a deep understanding of the underlying data, so during visualization they actually do nothing to help users comprehend the data easier or faster. The problem becomes even more apparent when the users troubleshooting infrastructure problems are the not the ones who developed the dashboards. In these cases all kinds of misunderstandings are possible, resulting in bad decisions and slower time to resolution.
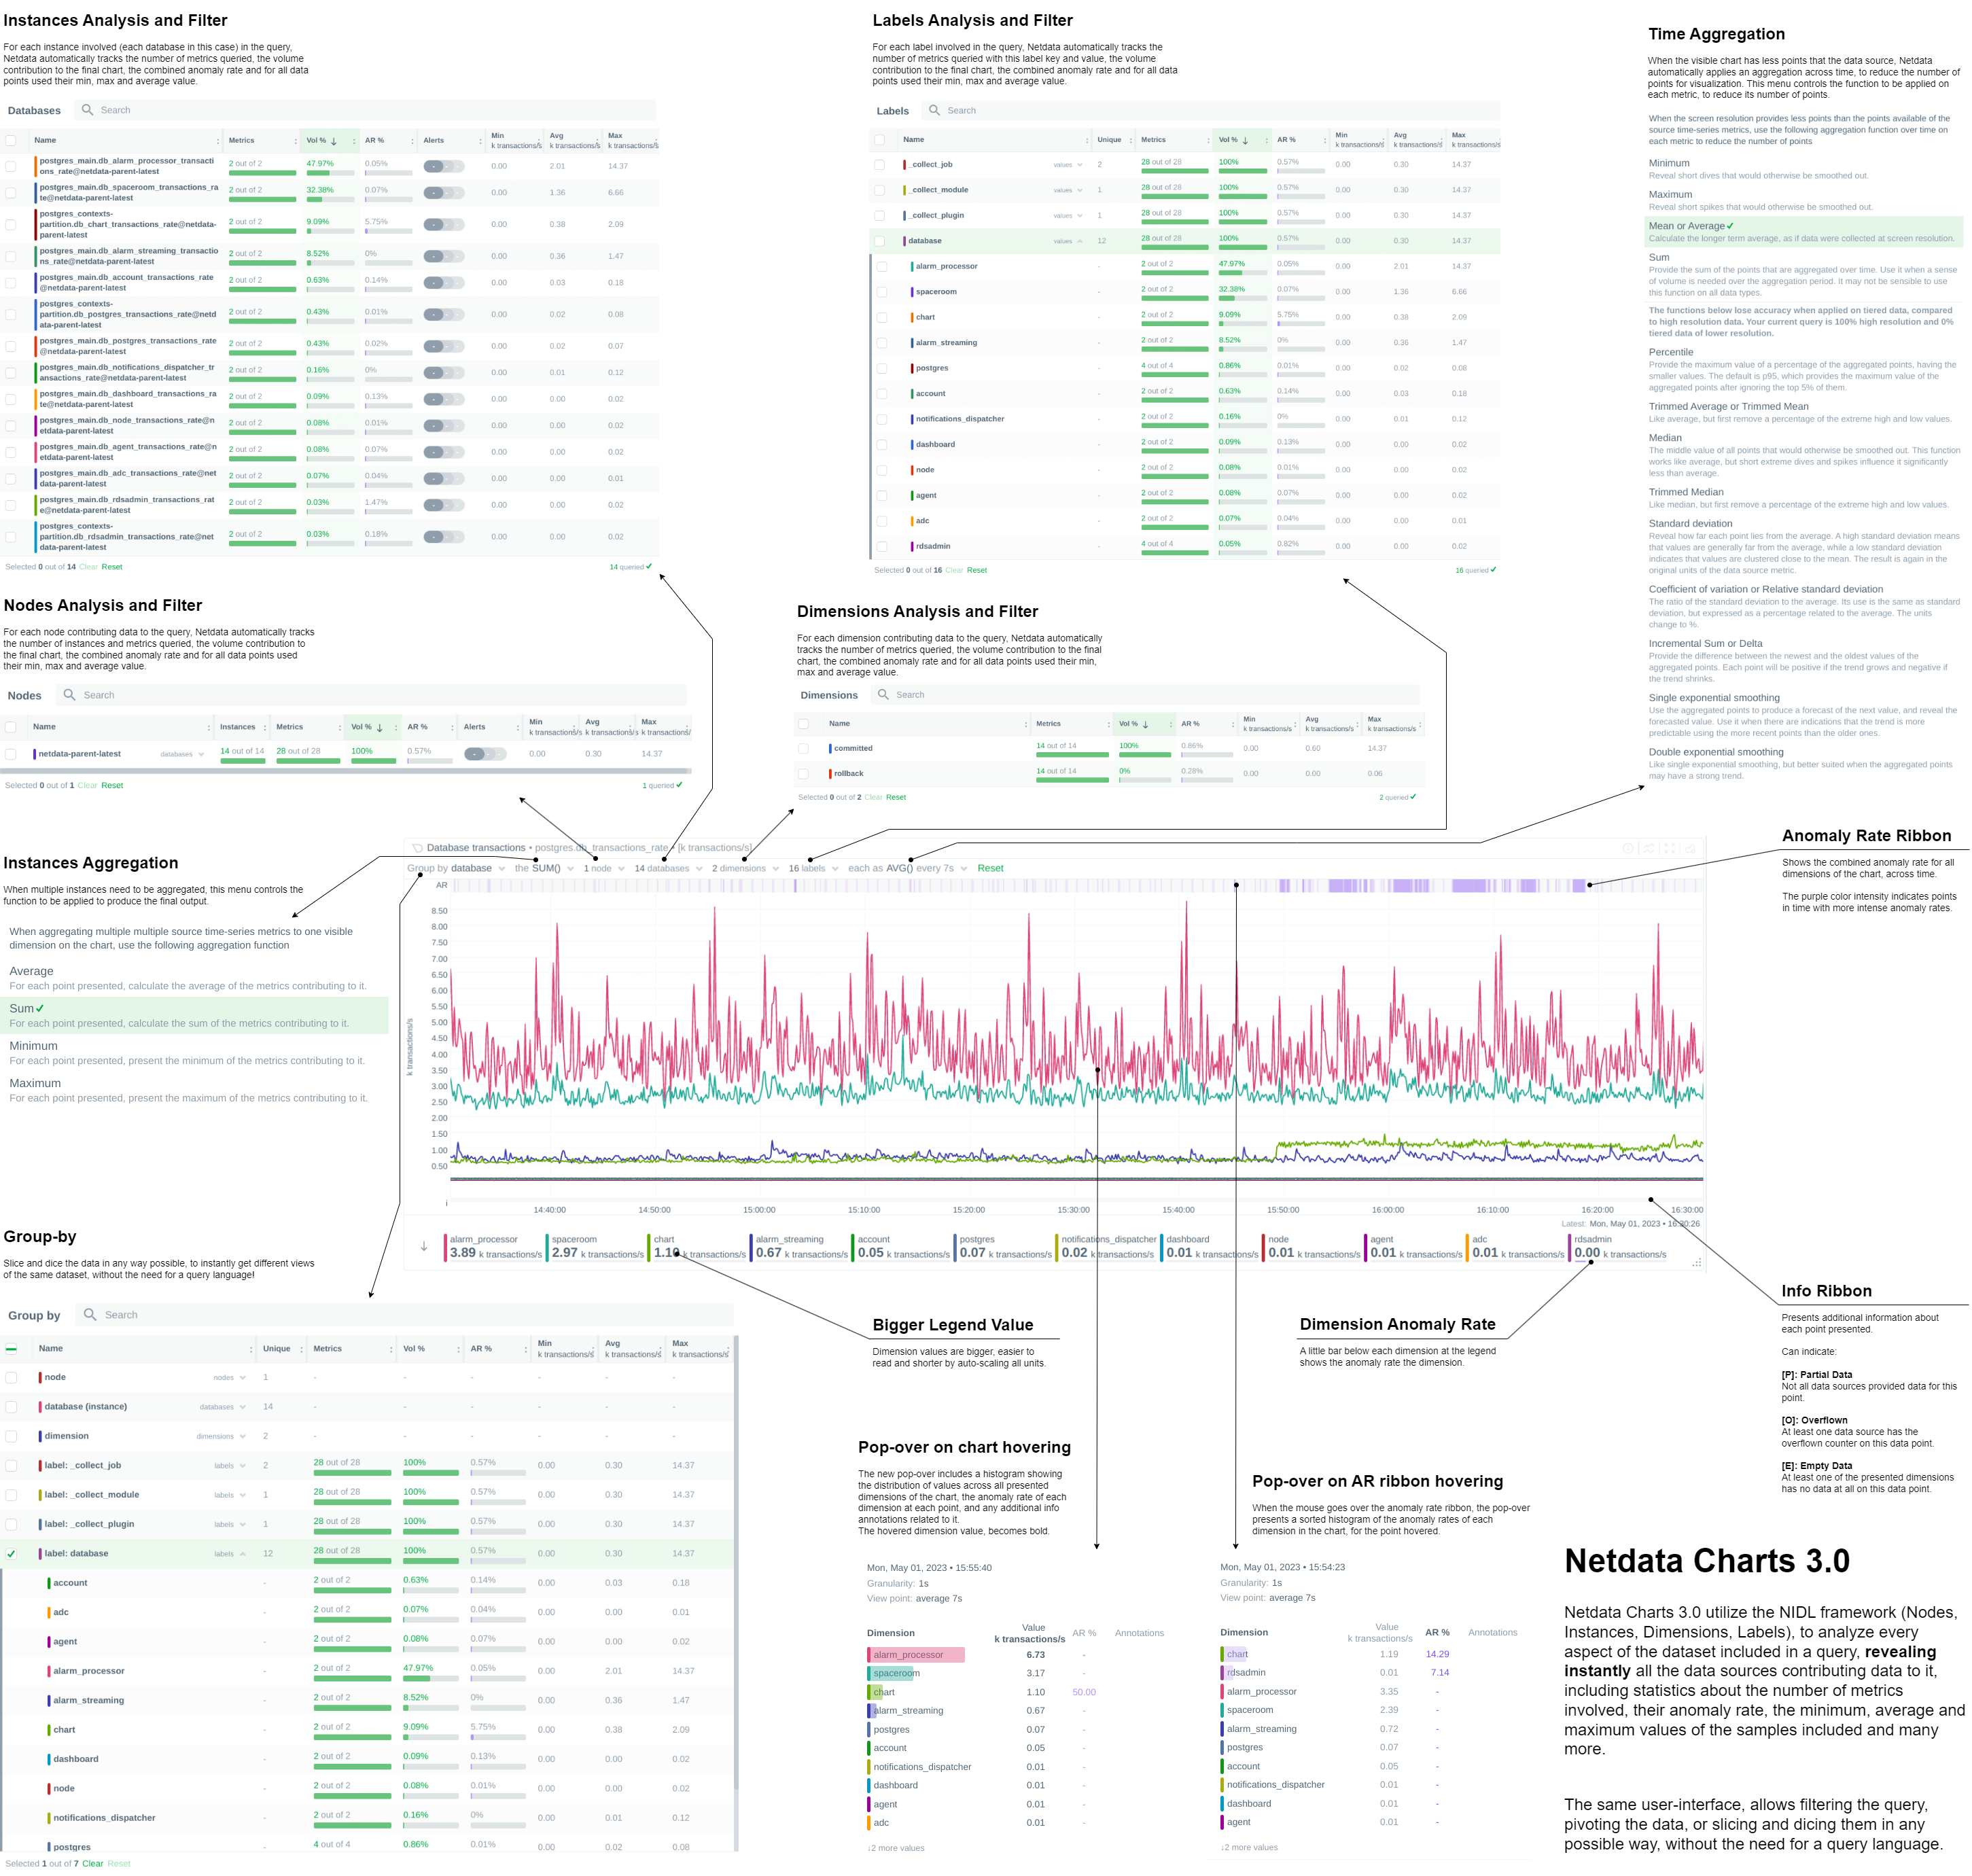
To help users instantly understand and validate the data they see on charts, we developed the NIDL (Nodes, Instances, Dimensions, Labels) framework and we changed all the Netdata query engines, at both the agent and the cloud, to enrich the returned data with additional information. This information is then visualized on all charts.
Click to read more about the changes
Embedded Machine Learning for every metric
Netdata's unsupervised machine learning algorithm creates a unique model for each metric collected by your agents, using exclusively the metric's past data. We don't train ML models on a lab, or on aggregated sample data. We then use these unique models during data collection to predict the value that should be collected and check if the collected value is within the range of acceptable values based on past patterns and behavior. If the value collected is an outlier, we mark it as anomalous. This unmatched capability of real-time predictions as data is collected allows you to detect anomalies for potentially millions of metrics across your entire infrastructure within a second of occurrence.
Before this release, users had to either go to the "Anomalies" tab, or enable anomaly rate information from a button on the charts to access the anomaly rate. We found that this was not very helpful, since a lot of users were not aware of this functionality, or they were forgetting to check it. So, we decided that the best use of this information is to visualize it by default on all charts, so that users will instantly see if the AI algorithm in Netdata believes the values are not following past behavior.
In addition to the summarized tables and chart overlay, a new anomaly rate ribbon on top of each chart visualizes the combined anomaly rate of all the underlying data, highlighting areas of interest that may not be easily visible to the naked eye.
Hovering over the anomaly rate ribbon provides a histogram of the anomaly rates per dimension presented, for the specific point in time.

Anomaly rate visualization does not make Netdata slower. Anomaly rate is saved in the the Netdata database, together with metric values, and due to the smart design of Netdata, it does not even incur a disk footprint penalty.
Introducing chart annotations for comprehensive context
Chart annotations have arrived! When hovering over the chart, the overlay may display an indication in the "Info" column.
Currently, annotations are used to inform users of any data collection issues that might affect the chart. Below each chart, we added an information ribbon. This ribbon currently shows 3 states related to the points presented in the chart:
-
[P]: Partial Data
At least one of the dimensions in the chart has partial data, meaning that not all instances available contributed data to this point. This can happen when a container is stopped, or when a node is restarted. This indicator helps to gain confidence of the dataset, in situations when unusual spikes or dives appear due to infrastructure maintenance, or due to failures to part of the infrastructure. -
[O]: Overflowed
At least one of the datasources included in the chart was a counter that has overflowed exactly that point. -
[E]: Empty Data
At least one of the dimensions included in the chart has no data at all for the given points.
All these indicators are also visualized per dimension, in the pop-over that appears when hovering the chart.

New hover pop-over
Hovering over any point in the chart now reveals a more informative overlay. This includes a bar indicating the volume percentage of each time series compared to the total, the anomaly rate, and a notification if there are data collection issues (annotations from the info ribbon).
The pop-over sorts all dimensions by value, makes bold the closest dimension to the mouse and presents a histogram based on the values of the dimensions.

When hovering the anomaly ribbon, the pop-over sorts all dimensions by anomaly rate, and presents a histogram of these anomaly rates.
NIDL framework
You can now rapidly access condensed information for collected metrics, grouped by node, monitored instance, dimension, or any label key/value pair. Above all charts, there are a few drop-down menus. These drop-down menus have 2 functions:
- P...
v1.38.1
The first patch release for v1.38 updates the version of OpenSSL included in our static builds
and Docker images to v1.1.1t, to resolve a few moderate security vulnerabilities in v1.1.1n.
The patch also includes the following minor bug fixes:
- We fixed the handling of dimensions with no data in a specific timeframe.
When the metrics registry recorded a dimension as present in a specific timeframe, but the dimension did not have any data for that timeframe,
the query engine would return random data that happened to be in memory. - We fixed occasional crashes during shutdown when not using eBPF.
- We fixed the systemd service file handling on systems using a systemd version older than v235.
- We fixed build failures on FreeBSD 14 release candidates, FreeBSD < 13.1, and environments with Linux kernel version < 5.11.
Support options
As we grow, we stay committed to providing the best support ever seen from an open-source solution. Should you encounter
an issue with any of the changes made in this release or any feature in the Netdata Agent, feel free to contact us
through one of the following channels:
- Netdata Learn: Find documentation, guides, and reference material for monitoring and
troubleshooting your systems with Netdata. - GitHub Issues: Make use of the Netdata repository to report bugs or open
a new feature request. - GitHub Discussions: Join the conversation around the Netdata
development process and be a part of it. - Community Forums: Visit the Community Forums and contribute to the collaborative
knowledge base. - Discord: Jump into the Netdata Discord and hangout with like-minded sysadmins,
DevOps, SREs and other troubleshooters. More than 1300 engineers are already using it!
v1.38.0
-
-
DBENGINE v2
The new open-source database engine for Netdata Agents, offering huge performance, scalability and stability improvements, with a fraction of memory footprint! -
FUNCTION: Processes
Netdata beyond metrics! We added the ability for runtime functions, that can be implemented by any data collection plugin, to offer unlimited visibility to anything, even not-metrics, that can be valuable while troubleshooting. -
Events Feed
Centralized view of Space and Infrastructure level events about topology changes and alerts. -
NOTIFICATIONS: Slack, PagerDuty, Discord, Webhooks
Netdata Cloud now supports Slack, PagerDuty, Discord, Webhooks. -
Role-based access model
Netdata Cloud supports more roles, offering finer control over access to infrastructure.
-
-
Integrations
New and improved plugins for data collection, alert notifications, and data exporters. -
Health Monitoring and Alerts Notification Engine
Changes to the Netdata Health Monitoring and Notifications engine.
❗We are keeping our codebase healthy by removing features that are end-of-life. Read the deprecation notice to check if you are affected.
Netdata open-source growth
- Almost 62,000 GitHub Stars
- Over four million monitored servers
- Almost 88 million sessions served
- Over 600 thousand total nodes in Netdata Cloud
Release highlights
Dramatic performance and stability improvements, with a smaller agent footprint
We completely reworked our custom-made, time series database (dbengine), resulting in stunning improvements to performance, scalability, and stability, while at the same time significantly reducing the agent memory requirements.
On production-grade hardware (e.g. 48 threads, 32GB ram) Netdata Agent Parents can easily collect 2 million points/second while servicing data queries for 10 million points / second, and running ML training and Health querying 1 million points / second each!
For standalone installations, the 64bit version of Netdata runs stable at about 150MB RAM (Reside Set Size + SHARED), with everything enabled (the 32bit version at about 80MB RAM, again with everything enabled).

Read more about the changes over dbengine v1
Key highlights of the new dbengine
Disk based indexing
We introduced a new journal file format (*.jnfv2) that is way faster to initialize during loading. This file is used as a disk-based index for all metric data available on disk (metrics retention), reducing the memory requirements of dbengine by about 80%.
New caching
3 new caches (main cache, open journal cache, extent cache) have been added to speed up queries and control the memory footprint of dbengine.
These caches combined, offer excellent caching even for the most demanding queries. Cache hit ratio now rarely falls bellow 50%, while for the most common use cases, it is constantly above 90%.
The 3 caches support memory ballooning and autoconfigure themselves, so they don't require any user configuration in netdata.conf.
At the same time, their memory footprint is predictable: twice the memory of the currently collected metrics, across all tiers. The exact equation is:
METRICS x 4KB x (TIERS - 1) x 2 + 32MB
Where:
METRICS x 4KB x TIERSis the size of the concurrently collected metrics.4KBis the page size for each metric.TIERSis whatever configured for[db].storage tiersinnetdata.conf; use(TIERS - 1)when using 3 tiers or more (3 is the default).x 2 + 32MBis the commitment of the new dbengine.
The new combination of caches makes Netdata memory footprint independent of retention! The amount of metric data on disk, does not any longer affect the memory footprint of Netdata, it can be just a few MB, or even hundreds of GB!
The caches try to keep the memory footprint at 97% of the predefined size (i.e. twice the concurrently collected metrics size). They automatically enter a survival mode when memory goes above this, by paralleling LRU evictions and metric data flushing (saving to disk). This system has 3 distinct levels of operation:
- aggressive evictions, when caches are above 99% full; in this mode cache query threads are turned into page evictors, trying to remove the least used data from the caches.
- critical evictions, when caches are above 101% full; in this mode every thread that accesses the cache is turned into a batch evictor, not leaving the cache until the cache size is again within acceptable limits.
- flushing critical, when too many unsaved data reside in memory; in this mode, flushing is parallelized, trying to push data to disk as soon as possible.
The caches are now shared across all dbengine instances (all tiers).
LRU evictions are now smarter: the caches know when metrics are referenced by queries or by collectors and favor the ones that have been used recently by data queries.
New dbengine query engine
The new dbengine query engine is totally asynchronous, working in parallel while other threads are processing metrics points. Chart and Context queries, but also Replication queries, now take advantage of this feature and ask dbengine to preload metric data in advance, before they are actually needed. This makes Netdata amazingly fast to respond in data queries, even on busy parent that at the same time collect millions of points.
At the same time we support prioritization of queries based on their nature:
- High priority queries, are all those that can potentially block data collection. Such queries are tiers backfilling and the last replication query for each metric (immediately after which, streaming is enabled).
- Normal priority queries, are the ones that are initiated by users.
- Low priority queries, are the ones that can be delayed without affecting quality of the results, like Health and Replication queries.
- Best effort queries, are the lowest priority ones and are currently used by ML training queries.
Starvation is prevented by allowing 2% of lower priority queries for each higher priority queue. So, even when backfilling is performed full speed at 15 million points per second, user queries are satisfied up to 300k points per second.
Internally all caches are partitioned to allow parallelism up to the number of cores the system has available. On busy parents with a lot of data and capable hardware it is now easy for Netdata to respond to queries using 10 million points per second.
At the same time, extent deduplication has been added, to prevent the unnecessary loading and uncompression of an extent multiple times in a short time. This works like this: while a request to load an extent is in flight, and up to the time the actual extent has been loaded and uncompressed in memory, more requests to extract data from it can be added to the same in flight request! Since dbengine trying to keep metrics of the same charts to the same extent, combined with the feature we added to prepare ahead multiple queries, this extent deduplication now provides hit of above 50% for normal chart and context queries!
Metrics registry
A new metrics registry has been added that maintains an index of all metrics in the database, for all tiers combined.
Initialization is the metrics registry is fully multithreaded utilizing all the resources available on busy parents, improving start-up times significantly.
This metrics registry is now the only memory requirement related to retention. It keeps in memory the first and the last timestamps, along with a few more metadata, of all the metrics for which retention is available on disk. The metrics registry needs about 150 bytes per metric.
Streaming
The biggest change in streaming is that the parent agents now inherit the clock of their children, for their data. So, all timestamps about collected metrics reflect the timestamps on the children that collected them. If a child clock is ahead of the parent clock, the parent will still accept collected points for the child, and it will process them and save them, but on parent node restart the parent will refuse to load future data about a child database. This has been done in such a way that if the clock of the child is fixed (by adjusting it backwards), after a parent restart the child will be able to push fresh metrics to the parent again.
Related to the memory footprint of the agent, streaming buffers were ballooning up to the configur...
Contributors
Assets 15
v1.37.1
Netdata v1.37.1 is a patch release to address issues discovered since v1.37.0. Refer to the v.1.37.0 release notes for the full scope of that release.
The v1.37.1 patch release fixes the following issues:
- Parent agent crash when many children instances (re)connect at the same time, causing simultaneous SSL re-initialization (PR #14076).
- Agent crash during dbengine database file rotation while a page is being read while being deleted (PR #14081).
- Agent crash on metrics page alignment when metrics were stopped being collected for a long time and then started again (PR #14086).
- Broken Fedora native packages (PR #14082).
- Fix dbengine backfilling statistics (PR #14074).
In addition, the release contains the following optimizations and improvements:
- Improve workers statistics performance (PR #14077).
- Improve replication performance (PR #14079).
- Optimize dictionaries (PR #14085).
Support options
As we grow, we stay committed to providing the best support ever seen from an open-source solution. Should you encounter
an issue with any of the changes made in this release or any feature in the Netdata Agent, feel free to contact us
through one of the following channels:
- Netdata Learn: Find documentation, guides, and reference material for monitoring and troubleshooting your systems with Netdata.
- GitHub Issues: Make use of the Netdata repository to report bugs or open a new feature request.
- GitHub Discussions: Join the conversation around the Netdata development process and be a part of it.
- Community Forums: Visit the Community Forums and contribute to the collaborative knowledge base.
- Discord: Jump into the Netdata Discord and hang out with like-minded sysadmins, DevOps, SREs, and other troubleshooters. More than 1300 engineers are already using it!
v1.37.0
IMPORTANT NOTICE
This release fixes two security issues, one in streaming authorization and another at the execution of alarm notification commands. All users are advised to update to this version or any later! Credit goes to Stefan Schiller of SonarSource.com for identifying both of them. Thank you, Stefan!
Netdata release v1.37 introduction
Another release of the Netdata Monitoring solution is here!
We focused on these key areas:
- Infinite scalability of the Netdata Ecosystem
- Default Database Tiering, offering months of data retention for typical Netdata Agent installations with default settings and years of data retention for dedicated Netdata Parents.
- Overview Dashboards at Netdata Cloud got a ton of improvements to allow slicing and dicing of data directly on the UI and overcome the limitations of the web technology when thousands of charts are presented on one page.
- Integration with Grafana for custom dashboards, using Netdata Cloud as an infrastructure-wide time-series data source for metrics
- PostgreSQL monitoring completely rewritten offering state-of-the-art monitoring of the database performance and health, even at the table and index level.
Read more about this release in the following sections!
Table of contents
- Release Highlights
- Infinite scalability
- Database retention
- New and improved system service integration
- Plugins function extension
- Disk based data indexing
- Overview dashboard
- Single node dashboard improvements
- Netdata data source plugin for Grafana
- New Unseen node state
- Blogposts & demo space use-case rooms
- Tech debt and performance improvements
- Internal Improvements
- Acknowledgments
- Contributions
- Deprecation and product notices
- Netdata release meetup
- Support options
❗ We're keeping our codebase healthy by removing features that are end of life. Read the deprecation notices to check if you are affected.
Netdata open-source growth
- Over 61,000 GitHub Stars
- Almost four million monitored servers
- Almost 85 million sessions served
- Rapidly approaching a half million total nodes in Netdata Cloud
Release highlights
Infinite scalability
Scalability is one of the biggest challenges of monitoring solutions. Almost every commercial or open-source solution assumes that metrics should be centralized to a time-series database, which is then queried to provide dashboards and alarms. This centralization, however, has two key problems:
- The scalability of the monitoring solutions is significantly limited, since growing these central databases can quickly become tricky, if it is possible at all.
- To improve scalability and control the monitoring infrastructure cost, almost all solutions limit granularity (the data collection frequency) and cardinality (the number of metrics monitored).
At Netdata we love high fidelity monitoring. We want granularity to be "per second" as a standard for all metrics, and we want to monitor as many metrics as possible, without limits.
Read more about our improvements to scalability
The only way to achieve our goal is by scaling out. Instead of centralizing everything into one huge time-series database, we have many smaller centralization points that can be used seamlessly all together like a giant distributed database. **This is what Netdata Cloud does!** It connects to all your Netdata agents and seamlessly aggregates data from all of them to provide infrastructure and service level dashboards and alarms.
Netdata Cloud does not collect or store all the data collected; that is one of its most beautiful and unique qualities. It only needs active connections to the Netdata Agents having the metrics. The Netdata Agents store all metrics in their own time-series databases (we call it dbengine, and it is embedded into the Netdata Agents).
In this release, we introduce a new way for the Agents to communicate their metadata to the cloud. To minimize the amount of traffic exchanged between Netdata Cloud and Agents, we only transfer a very limited information of metadata. We call this information contexts, and it is pretty much limited to the unique metric names collected, coupled with the actual retention (first and last timestamps) that each agent has available for query.
At the same time, to overcome the limitations of having hundreds of thousands of Agents concurrently connected to Netdata Cloud, we are now using EMQX as the message broker that connects Netdata Agents to Netdata Cloud. As the community grows, the next step planned is to have such message brokers in five continents, to minimize the round-trip latency for querying Netdata Agents through Netdata Cloud.
We also see Netdata Parents as a key component of our ecosystem. A Netdata Parent is a Netdata Agent that acts as a centralization point for other Netdata Agents. The idea is simple: any Netdata Agent (Child) can delegate all its functions, except data collection, to any other Netdata Agent (Parent), and by doing so, the latter now becomes a Netdata Parent. This means that metrics storage, metrics querying, health monitoring, and machine learning can be handled by the Netdata Parent, on behalf of the Netdata Children that push metrics to it.
This functionality is crucial for our ecosystem for the following reasons:
- Some nodes are ephemeral and may vanish at any point in time. But we need their metric data.
- Other nodes may be too sensitive to run all the features of a Netdata Agent. On such nodes we needed a way to use the absolute minimum of system resources for anything else except the core application that the node is hosting. So, on these Netdata Agents we can disable metrics storage, health monitoring, machine learning and push all metrics to another Netdata Agent that has the resources to spare for these tasks.
- High availability of metric data. In our industry, "one = none." We need at least 2 of everything and this is true for metric data too. Parents allow us to replicate databases, even having different retention on each, thus significantly improving the availability of metrics data.
In this release we introduce significant improvements to Netdata Parents:
- Streaming Compression
The communication between Netdata Agents is now compressed using LZ4 streaming compression, saving more than 70% of the bandwidth. TLS communication was already implemented and can be combined with compression. - Active-Active Parents Clusters
A Parent cluster of 2+ nodes can be configured by linking each of the parents to the others. Our configuration can easily take care of the circular dependency this implies. For 2 nodes you configure: A->B and B<-A. For 3 nodes: A->B/C, B->A/C, C->A/B. Once the parents are set up, configure Netdata Agents to push metrics to any of them (for 2 Parent nodes: A/B, for 3 Parent nodes: A/B/C). Each Netdata Agent will send metrics to only one of the configured parents at a time. But any of them. Then the Parent agents will re-stream metrics to each other. - Replication of past data
Now Parents can request missing data from each other and the origin data collecting Agent. This works seamlessly when two agents connect to each other (both have to be the latest version). They exchange information about the retention each has and they automatically fill in the gaps of the Parent agent, ensuring no data are lost at the Parents, even if a Parent was offline for some time (the default max replication duration is 1 day, but it can be tuned instream.conf- and the connecting Agent Child needs to have data for at least that long in order for them to be replicated). - Performance Improvements
Now Netdata Parents can digest about 700k metric values per second per origin Agent. This is a huge improvement over the previous one of 400k. Also, when establishing a connection, the agents can accept about 2k metadata definitions per second per origin Agent. We moved all metadata management to a separate thread, and now we are experiencing 80k metric definitions per second per origin Agent, making new Agent connections enter the metrics streaming phase almost instantly.
All these improvements establish a huge step forward in providing an infinitely scalable monitoring infrastructure.
Database retention
Many users think of Netdata Agent as an amazing single node-monitoring solution, offering limited real-time retention to metrics. This changed slightly over the years as we intr...
v1.36.1
Release v1.36.1
Netdata v1.36.1 is a patch release to address two issues discovered since v1.36.0. Refer to the v.1.36.0 release notes for the full scope of that release.
The v1.36.1 patch release fixes the following:
- An issue that could cause agents running on 32bit distributions to crash during data exchange with the cloud (PR #13511).
- An issue with the handling of the Go plugin in the installer code that prevented the new WireGuard collector from working without user intervention (PR # 13507).
Support options
As we grow, we stay committed to providing the best support ever seen from an open-source solution. Should you encounter
an issue with any of the changes made in this release or any feature in the Netdata Agent, feel free to contact us
through one of the following channels:
- Netdata Learn: Find documentation, guides, and reference material for monitoring and
troubleshooting your systems with Netdata. - Github Issues: Make use of the Netdata repository to report bugs or open
a new feature request. - Github Discussions: Join the conversation around the Netdata
development process and be a part of it. - Community Forums: Visit the Community Forums and contribute to the collaborative
knowledge base. - Discord: Jump into the Netdata Discord and hangout with like-minded sysadmins,
DevOps, SREs and other troubleshooters. More than 1100 engineers are already using it!
v1.36.0
Release v1.36
Table of contents
- Release highlights
- Acknowledgments
- Contributions
- Deprecation notice
- Netdata Release Meetup
- Support options
❗ We're keeping our codebase healthy by removing features that are end of life. Read the deprecation notice to check if you are affected.
Netdata open-source growth
- 7.6M+ troubleshooters monitor with Netdata
- 1.6M unique nodes currently live
- 3.3k+ new nodes per day
- Over 557M Docker pulls all-time total
- Over 60,000 stargazers on GitHub
Release highlights
Metric correlations
New metric correlation algorithm (tech preview)
The Agent's default algorithm to run a metric correlations job (ks2) is based on Kolmogorov-Smirnov test. In this release, we also included the Volume algorithm, which is an heuristic algorithm based on the percentage change in averages between the highlighted window and a baseline, where various edge cases are sensibly controlled. You can explore our implementation in the Agent's source code
This algorithm is almost 73 times faster than the default algorithm (named ks2) with near the same accuracy. Give it a try by enabling it by default in your netdata.conf.
[global]
   # enable metric correlations = yes
   metric correlations method = volume
Cooperation of the Metric Correlations (MC) component with the Anomaly Advisor
The Anomaly Advisor feature lets you quickly surface potentially anomalous metrics and charts related to a particular highlight window of interest. When the Agent trains its internal Machine Learning models, it produces an Anomaly Rate for each metric.
With this release, Netdata can now perform Metric Correlation jobs based on these Anomalous Rate values for your metrics.
Metric correlations dashboard
In the past, you used to run MC jobs from the Node's dashboard with all the settings predefined. Now, Netdata gives you some extra functionality to run an MC job for a window of interest with the following options:
- To run an MC job on both Metrics and their Anomaly Rate
- To change the aggregation method of datapoints for the metrics.
- To choose between different algorithms
All this from the same, single dashboard.

What's next with Metric Correlations
Troubleshooting complicated infrastructures can get increasingly hard, but Netdata wants to continually provide you with the best troubleshooting experience. On that note, here are some next logical steps for for our Metric Correlations feature, planned for upcoming releases:
- Enriching the Agent with more Metric Correlation algorithms.
- Making the Metric Correlation component run seamless (you can explore the
/weightsendpoint in the Agent's API; this is a WIP). - Giving you the ability to run Metric Correlation Jobs across multiple nodes.
Be on the lookout for these upgrades and feel free to reach us in our channels with your ideas.
Tiering, providing almost unlimited metrics for your nodes
Netdata is a high fidelity monitoring solution. That comes with a cost, the cost of keeping those data in your disks. To help remedy this cost issue, Netdata introduces with this release the Tiering mechanism for the Agent's time-series database (dbengine).
Tiering is the mechanism of providing multiple tiers of data with different granularity on metrics by doing the following:
- Downsampling the data into lower resolution data.
- Keeping statistical information about the metrics to recreate the original* metrics.
Visit the Tiering in a nutshell section in our docs to understand the maximum potential of this feature. Also, don't hesitate to enable this feature to change the retention of your metrics
Note: *Of course the metric may vary; you can just recreate the exact time series without taking into consideration other parameters.
Kubernetes
A Kubernetes Cluster can easily have hundreds (or even thousands) of pods running containers. Netdata is now able to provide you with an overview of the workloads and the nodes of your Cluster. Explore the full capabilities of the k8s_state module
Anomaly Rate on every chart
In a previous release, we introduced unsupervised ML & Anomaly Detection in Netdata with Anomaly Advisor. With this next step, we’re bringing anomaly rates to every chart in Netdata Cloud. Anomaly information is no longer limited to the Anomalies tab and will be accessible to you from the Overview and Single Node view tabs as well. We hope this will make your troubleshooting journey easier, as you will have the anomaly rates for any metric available with a single click, whichever metric or chart you happen to be exploring at that instant.
If you are looking at a particular metric in the overview or single node dashboard and are wondering if the metric was truly anomalous or not, you can now confirm or disprove that feeling by clicking on the anomaly icon and expanding the anomaly rate view. Anomaly rates are calculated per second based on ML models that are trained every hour.

For more details please check our blog post and video walkthrough.
Centralized Admin Interface & Bulk deletion of offline nodes
We've listened and understood the your pain around Space and War Room settings in Netdata Cloud. In response, we have simplified and organized these settings into a Centralized Administration Interface!
In a single place, you're now able to access and change attributes around:
- Space
- War Rooms
- Nodes
- Users
- Notifications
- Bookmarks

Along with this change, the deletion of individual offline nodes has been greatly improved. You can now access the Space settings, and on Nodes within which it is possible to filter all Offline nodes, you can now mass select and bulk delete them.
Agent and Cloud chart metadata syncing
On this release, we are doing a major improvement on our chart metadata syncing protocol. We moved from a very granular message exchange at chart dimension level to a higher level at context.
This approach will allow us to decrease the complexity and points of failure on this flow, since we reduced the number of events being exchanged and scenarios that need to be dealt with. We will continuously fix complex and hard-to-track existing bugs and any potential unknown ones.
This will also bring a lot of benefits to data transfer between Agents to Cloud, since we reduced the number of messages being transmitted.
To sum up these changes:
- The traffic between Netdata cloud and Agents is reduced significantly.
- Netdata Cloud scales smoother with hundreds of nodes.
- Netdata Cloud is aware of charts and nodes metadata.
Visualization improvements
Composite chart enhancements
We have restructured composite charts into a more natural presentation. You can now read composite charts as if reading a simple sentence, and make better sense of how and what queries are being triggered.
In addition to this, we've added additional control over time aggregations. You can now instruct the agent nodes on what type of aggregation you want to apply when multiple points are grouped into a single one.
The options available are: min, max, average, sum...