Releases: netdata/netdata
v1.35.1
Netdata v1.35.1 is a patch release to address issues discovered since v1.35.0. Refer to the v.1.35.0 release notes for the full scope of that release.
The v1.35.1 patch release fixes an issue in the static build installation code that causes automatic updates to be unintentionally disabled when updating static installs.
If you have installed Netdata using a static build since 2022-03-22 and you did not explicitly disable automatic updates, you are probably affected by this bug.
For more details, including info on how to re-enable automatic updates if you are affected, refer to this Github issue.
Support options
As we grow, we stay committed to providing the best support ever seen from an open-source solution. Should you encounter
an issue with any of the changes made in this release or any feature in the Netdata Agent, feel free to contact us
through one of the following channels:
- Netdata Learn: Find documentation, guides, and reference material for monitoring and
troubleshooting your systems with Netdata. - Github Issues: Make use of the Netdata repository to report bugs or open
a new feature request. - Github Discussions: Join the conversation around the Netdata
development process and be a part of it. - Community Forums: Visit the Community Forums and contribute to the collaborative
knowledge base. - Discord: Jump into the Netdata Discord and hangout with like-minded sysadmins,
DevOps, SREs and other troubleshooters. More than 1100 engineers are already using it!
v1.35.0
Table of contents
- Release highlights
- Acknowledgments
- Contributions
- Deprecation notice
- Netdata Agent release meetup
- Support options
❗ We're keeping our codebase healthy by removing features that are end of life. Read the deprecation notice to check if you are affected.
Netdata open-source Agent statistics
- 7.6M+ troubleshooters monitor with Netdata
- 1.3M+ unique nodes currently live
- 3.3k+ new nodes per day
- Over 556M Docker pulls all-time total
Release highlights
Anomaly Advisor & on-device Machine Learning
We are excited to launch one of our flagship machine learning (ML) assisted troubleshooting features in Netdata: the Anomaly Advisor.
Netdata now comes with on-device ML! Unsupervised ML models are trained for every metric, at the edge (on your devices), enabling real time anomaly detection across your infrastructure.

This feature is part of a broader philosophy we have at Netdata when it comes to how we can leverage ML-based solutions to help augment and assist traditional troubleshooting workflows, without having to centralize all your data.
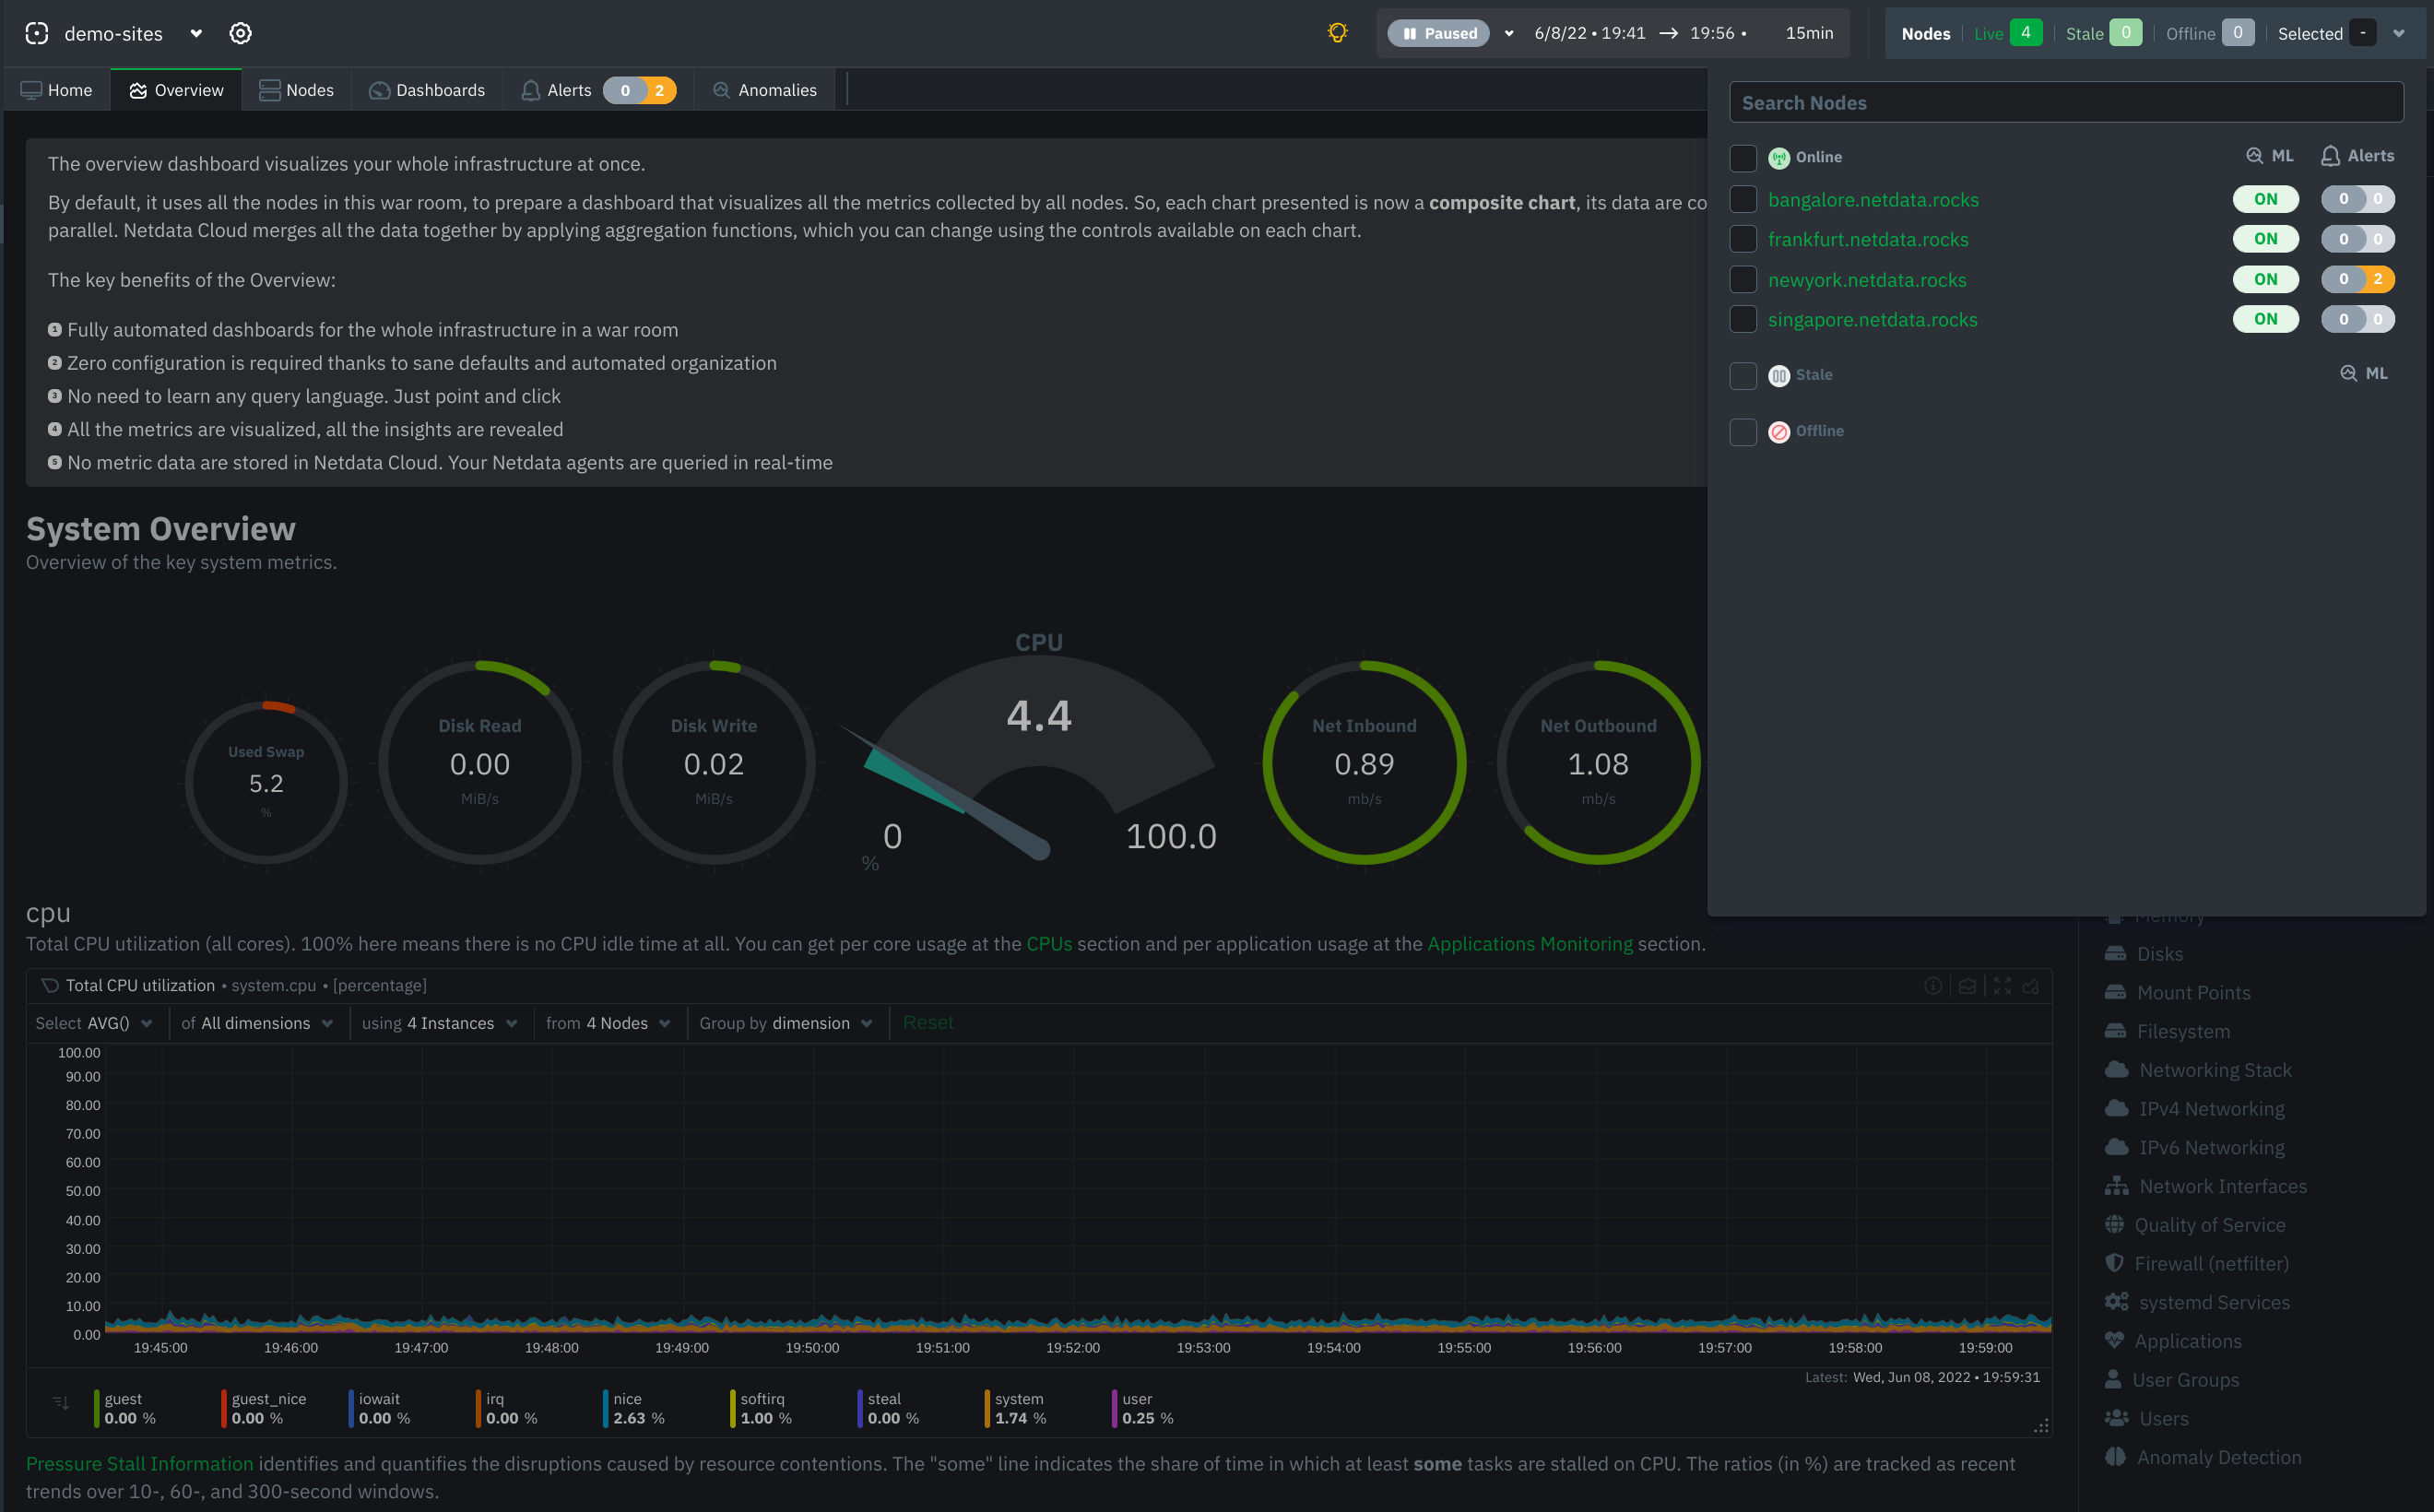
The new Anomalies tab quickly lets you find periods of time with elevated anomaly rates across all of your nodes. Once you highlight a period of interest, Netdata will generate a ranked list of the most anomalous metrics across all nodes in the highlighted timeframe. The goal is to quickly let you find periods of abnormal activity in your infrastructure and bring to your attention the metrics that were most anomalous during that time.
In our latest release, we improved the usability of Anomaly Advisor and also ensured that the anomalous metrics are always relevant to the time period you are investigating.
A great deal of care has gone into ensuring that ML running on your device is as light weight in terms of resource consumption as possible. For instance, metrics that do not have sufficient data for training and metrics that are consistently constant during training periods are considered to be "normal" until their behavior changes significantly to require re-training of the ML models.
To use this feature, please enable ML on your agent and then navigate to the "Anomalies" tab in Netdata cloud. Update netdata.conf with the following information to enable ML on your agent:
[ml]
    enabled = yes
Read more about Anomaly Advisor at our blog.
Metrics Correlation on Agent
Metric Correlations allow you to quickly find metrics and charts related to a particular window of interest that you want to explore further. Metric correlations compare two adjacent windows to find how they relate to each other, and then score all metrics based on this rating, providing a list of metrics that may have influence or have been influenced by the highlighted one.
Metric Correlation was already available in Netdata Cloud, but now we are releasing a version implemented at the Netdata Agent, which drastically reduces the time required for to run. This means the metric correlation can now run almost instantly (more than 10x faster than before)!
To enable the new metric correlation at the Netdata Agent, set the following in your netdata.conf file:
[global]
    enable metric correlations = yes
Kubernetes monitoring
On very busy Kubernetes clusters where hundreds of containers spawn and are destroyed all the time, Netdata was consuming a lot of resources and was slow to detect changes and under certain conditions it missed certain containers.
Now, Netdata:
- Detects "pause" containers and skips them greatly improving the performance during discovery
- Detects containers that are initializing and postpones discovery for them until they are properly initialized
- Utilizes less resources more efficiently during container discovery
Netdata is also capable of detecting the network interfaces that have been allocated to containers, by spawning a process that switches network namespace and identifies virtual interfaces that belong to each container. This process is improved drastically, now requiring 1/3 of the CPU resources it needed before.
Additionally, Netdata cgroups.plugin now collects CPU shares for Kubernetes containers, allowing the visualization of the Kubernetes CPU Requests (Kubernetes writes in cgroup CPU Shares the CPU Requests that have been configured for the containers).
A new option has been added in netdata.conf [plugin:cgroup] section, to allow filtering containers by (resolved) name. It matches the name of the cgroup (as you see it on the dashboard).
We have also released a blog post and a video about CPU Throttling in Kubernetes. You will be amazed by our findings. Read the blog and watch the video about Kubernetes CPU throttling.
Visualization improvements
Netdata Cloud dashboards are now a lot faster in aggregating data from multiple agents, as the protocol between agents and the Cloud is approaching its final shape.
New look for Netdata charts
Netdata Cloud has a new look and feel for charts, which resembles the look and feel for coding IDEs:

New home for war rooms
The new home tab for war rooms allows you to quickly inspect the most important metrics for every war room, like number of nodes, metrics, retention, replication, alerts, users, custom dashboards, etc.

Time units
Time units now in charts auto-scale from microseconds to days, automatically based on the value of time to be shown.
Cloud queries timeout
The agent now sets a timeout on every query it sends to the agents, and the agents now respect this timeout. Previously, the cloud was timing out because of a slow query, but the agents remained busy executing that query, which had a waterfall effect on the agent load.
Custom dashboards
Custom dashboards on Netdata Cloud can now be renamed.
Alerts management
All configured alerts on the Cloud
We have added a new Alert Configs sub tab which lists all the alerts configured on all the nodes belonging to the war room. You have now a possibility of listing the alerts configured in the - war room, nodes and alert instances respectively.
Stale alerts
There have been a number of corner cases under which alerts could remain raised on Netdata cloud. We identified all such cases, and now Netdata Cloud is always in sync with Netdata agents about their alerts.
Nodes management
Cloud provider metadata
Netdata now identifies the Cloud provider node type it runs on. It works for GCP and AWS, and exposes this information at the Nodes tab, the single node dashboard, and the node inspector.

Virtualization detection fixes
We improved the virtualization detection in cases where systemd is not available. Now Netdata can properly detect virtualization even in these cases.
Global nodes filter on all tabs of a space
The new Netdata Cloud now supports a global filter on nodes of war rooms. The new filter is applied on every tab for each room, allowing users to quickly switch between tabs while retaining the nodes filtered.
Obsoletion of nodes
Netdata...
v1.34.1
This patch release fixes versioning issues that occured in the latest release (Netdata v1.34):
- The release artifacts on the release itself showed a version of v1.33.1-339-g0046735ba instead of v1.34.0
- The binaries for the release, irrespective of the source, also showed the same version.
- The Docker images for the release have incorrect image tags that are inconsistent with our previous Docker image tag.
- Git tags ended up partially duplicated.
Support options
Supporting people in using and building with Netdata is very important to us! Should you need any help or encounter an issue with any of the changes made in this release, feel free to get in touch with the community through the following channels:
- GitHub: Report bugs or submit a new feature request.
- GitHub Discussions: Share your ideas, and be part of the Netdata Agent development process.
- Community forum: Collaborate with other troubleshooters in building a community-driven knowledge base around Netdata.
- Discord: Join us in celebrating the culture of infrastructure monitoring. Hang out with like-minded sysadmins, SREs, and troubleshooters.
v1.34.0
Table of contents
- Kubernetes Monitoring: new charts for CPU throttling
- Machine learning (ML) powered anomaly detection
- Streaming compression now enabled by default
- SNMP collector now runs on Go
- Improved installation experience
❗ We're keeping our codebase healthy by removing features that are end of life. Read the deprecation notice to check if you are affected.
Netdata open-source Agent statistics
We're proud to empower each and every one of you to troubleshoot your infrastructure using Netdata:
- 7.3M+ troubleshooters monitor with Netdata
- 1.3M+ unique nodes currently live
- 3.3k+ new nodes per day
- 51k+ Docker pulls per day with 387M all-time total
If you're part of our community and love Netdata, please give us a star on GitHub⭐.
Release highlights
Kubernetes Monitoring: New charts for CPU throttling
Have you seen your applications get stuck or fail to respond to health checks? It might be the CPU quota limit!
Kubernetes relies on the kernel control group (cgroup) mechanisms to manage CPU constraints. The CPU quota is allocated based on a period of time, not on available CPU power. When an application has used its allotted quota for a given period, it gets throttled until the next period.
So if you don’t set your CPU limits correctly, your applications will be throttled while your CPU may be idle. And CPU throttling is really hard to identify since Kubernetes only exposes usage metrics.
In this release, we make troubleshooting Kubernetes even easier by adding two new charts for CPU throttling:
- CPU throttled Runnable Periods: The percentage of runnable periods when tasks in a cgroup have been throttled.
- CPU throttled Time Duration: The total time duration for which tasks in a cgroup have been throttled.

Machine learning (ML) powered anomaly detection
The performance of the machine learning threads have been significantly optimized in this release. We were able to reduce peak CPU usage considerably by sampling input data randomly and excluding constant metrics from training. That way, we've optimized performance while maintaining high levels of accuracy. If you're streaming data between nodes: We've optimized CPU usage on parent nodes with multiple child nodes by altering the training thread's max sleep time.
Streaming compression is now in Alpha
We introduced streaming compression in Netdata Agent v1.33.0 as a tech preview. The feature has matured a lot since then so we are moving forward to alpha stage. From now on, streaming compression will be enabled by default, allowing you to leverage faster streaming between parent and child nodes at a lower bandwidth.
SNMP collector now runs on Go
Go is known for its reliability and blazing speed - precisely what you need when monitoring networks. We've rewritten our SNMP collector from Node.js to Go. Apart from improved configuration options, the new collector eliminates the need for Node.js, slimming down our dependency tree.
Note: The node.js-based SNMP collector will be deprecated in the next release, see the deprecation notice.
📄 SNMP Go collector documentation
Improved installation experience
We have been improving our kickstart script to give you a smooth installation experience. We've added some handy features like:
- Dry run mode: Show what would be done without actually modifying the system, including reporting a number of common installation issues before they arise.
- Overhauled auto-update management: Including support for auto-updates with our native packages and much easier control of whether auto updates are enabled or not.
- Improved reinstallation support: With the new
--reinstall-cleanoption, you can now have the kickstart script cleanly uninstall an existing installation before installing Netdata again.
Acknowledgments
We would like to thank our dedicated, talented contributors that make up this amazing community. The time and expertise that you volunteer is essential to our success. We thank you and look forward to continue to grow together to build a remarkable product.
- @xrgman for fixing typos in our documentation.
- @wooyey for fixing a parsing error in python.d/hpssa collector.
- @tycho for fixing python collector that use
sudo. - @tnagorran for fixing a typo in the step-by-step Netdata guide.
- @rex4539 for fixing typos.
- @petecooper for improving the installer script usage message.
- @godismyjudge95 for fixing a bug in the updater script.
- @fayak for fixing parsing of claiming extra parameters in kickstart.
- @dvdmuckle for fixing a typo in ZFS ARC Cache size dashboard info.
- @d--j for fixing setting of 'time offset' configuration option in timex plugin.
- @cimnine for fixing a bug when
tarcan not set the correct permissions during installation. - @AlexGhiti for fixing building Netdata on riscv64.
- @Daniel15 for fixing license URL.
- @MariosMarinos for fixing a typo in the anomaly-detection-python.md file.
- @RatishT for fixing typo in Running-behind-haproxy.md.
- @DanTheMediocre for improving timex plugin documentation and dashboard info.
- @DanTheMediocre for fixing a typo in anomaly-detection-python.md.
- @Steve8291 for fixing ioping_disk_latency alarm lookup value.
- @Steve8291 for fixing config file check in stock config directory in ioping plugin.
- @Steve8291 for adding a link to Netdata badges readme in the health documentation.
- @Steve8291 for fixing libnetfilter-acct-dev package name in nfacct plugin documentation.
Collectors
New collectors
- Add CPU throttling charts (cgroups.plugin) (#12591, @ilyam8)
- Add clock status chart (timex.plugin) (#12501, @ilyam8)
- Add Asterisk configuration file with synthetic charts (statsd.plugin) (#12381, @ilyam8)
- Add new chart for process states metrics (apps.plugin) (#12305, @surajnpn)
- Add thermal zone metrics collection (go.d/wmi) (#667, @ilyam8)
- Add SNMP data collector (go.d/snmp) (#644, @surajnpn)
Improvements
⚙️ Enhancing our collectors to collect all the data you need.
See all pull requests
- Add 'locust' to apps_groups.conf (#12498, @andrewm4894)
- Enable timex plugin for non-linux systems (timex.plugin) (#12489, @surajnpn)
- Prefer 'blkio.*_recursive' files when available (cgroups.plugin) (#12462, @ilyam8)
- Add 'stress-ng' and 'gremlin' to apps_groups.conf (apps.plugin) (#12165, @andrewm4894)
- Add Apple Filing Protocol daemons into 'afp' group (apps.plugin) (#12078, @ilyam8)
- Show the number of processes/threads for empty apps groups (apps.plugin) (#11834, @vlvkobal)
- Add a configuration option to set application (go.d/prometheus) (#669, @ilyam8)
Bug fixes
🐞 Improving our collectors one bug fix at a time.
Release v1.33.1
Netdata v1.33.1 is a patch release to address issues discovered since v1.33.0.
This release contains bug fixes and documentation updates.
If you also use Netdata Cloud, please note that we started migrating nodes running on the old architecture to the new one. Most users don’t have to take any action on their part, but if you are affected by the migration, a banner will be added to your Cloud dashboard with a link to further instructions.
If you love Netdata and haven't yet considered giving us a Github star, we would appreciate for you to do so!
Acknowledgments
- @petecooper for fixing a typo and improving the installer script usage message.
- @mohammed90 for updating syntax for Caddy v2 in docker install guide.
Dashboard
- Add legacy protocol deprecation notification in the header (#12117)
- Fix handling of
afterandbeforeURL params in direct links (#12052)
Documentation
- Add a note that the Synology install guide is maintained by community (#12086, @ilyam8)
- Remove mention of libJudy in installation documentation for macOS (#12080, @vlvkobal)
- Make requirement of mounting the docker socket for containers name resolution explicit (#12079, @ilyam8)
- Cleanup installation docs (#12057, @kickoke)
- Improve Alerta readme (#11944, @kickoke)
- Fix unresolved file references (#12053, @ilyam8)
- Update the docs to match new installation script (#12042, @kickoke)
- Update syntax for Caddy v2 in docker install guide (#12092, @mohammed90)
- Fix paths to install boxes (#12109, @kickoke)
- Fix matching the new install box component name (#12106, @kickoke)
- Remove ACLK legacy documentation (#12103, @underhood)
- Add interactive kickstart scripts where possible (#12098, @kickoke)
Packaging / Installation
- Add native installation for Rocky linux (#12081, @maneamarius)
- Fix compilation errors for OpenSSL on macOS (#12048, @vlvkobal)
- Fix handling of non-x86 static builds in updater (#12055, @Ferroin)
- Fix handling of removed packages with leftover config files in installer (#12033, @Ferroin)
- Improve the installer script usage message (#12062, @petecooper)
- Add proper support for Oracle Linux native packages to installer (#12101, @Ferroin)
- Fix handling of Oracle Linux repoconfig packages (#12100, @Ferroin)
- Fix handling non-interactive installs as non-root users (#12089, @Ferroin)
- Add info about installer interactivity to anonymous installer telemetry events (#12088, @Ferroin)
- Make the netdata-installer script Posix compliant (#11961, @maneamarius)
- Make a lack of an os-release file non-fatal on install (#12087, @Ferroin)
Bug Fixes
- Fix compilation errors cased by including "lz4.h" when stream compression is disabled (#12049, @odynik)
- Disable ebpf socket thread causing crashes on some systems (#12085, @thiagoftsm)
- Fix ACLK reconnect endless loop (#12074, @underhood)
- Fix compilation errors when openssl is not available and compiling with --disable-https and --disable-cloud (#12071, @MrZammler)
Other Notable Changes
- Adds legacy protocol deprecation banner to agent log (#12065, @underhood)
Support options
As we grow, we stay committed to providing the best support ever seen from an open-source solution. Should you encounter an issue with any of the changes made in this release or any feature in the Netdata agent, feel free to contact us by one of the following channels:
- Github: You can use our Github repo to report bugs or open a new feature request.
- Github Discussions: We are using Github discussions to document our development process so you can be a part of it.
- Community forum: You can visit our community forum for questions and training.
- Discord: You can jump into our Discord for interactive, synchronous help and discussion. More than 800 engineers are already using it! Join us!
v1.33.0
Release v1.33.0
Happy New Year to everyone in the Netdata community. After one of our biggest releases ever, we have re-energized over the holidays and are ready to continue helping more people troubleshoot their infrastructure. Hopefully you've already heard about the improvements we made to the kickstart script. With this release, we're adding even more features:
- Netdata is now distributed as pre-built packages on many Linux distributions
- Stream compression (tech preview)
- eBPF CO-RE support
❗We're also keeping our codebase healthy by removing end-of-life features. Read the deprecation notice to check if you are affected.
If you love Netdata and haven't given us a yet Github star, please do, we would really appreciate it!
Netdata open-source Agent growth
The open-source Netdata Agent, the best OSS node monitoring and troubleshooting solution, currently has:
- 1,300,000 unique Netdata nodes live!
- An amazing adoption rate, with 3,300 new nodes per day!
- 280,000 Docker pulls per day with 375 million total, according to DockerHub!
Community news
Netdata is supported both by an active community of global contributors and the Netdata staff.
Get involved:
- Build with us on Netdata.
- Join us on Discord, and say hello.
- Contribute your knowledge with open GitHub issues.
- Launching soon, be on the lookout for our new monthly community awards
Release highlights
Netdata is now distributed as pre-built packages on many Linux distributions
We recently released a completely new version of our one-line installer code. Wherever available, our new kickstart script uses DEB or RPM packages provided by Netdata. These packages are tightly integrated with the package management system of the distribution, providing the best installation experience in a reliable and fast way.
Already over 70% of our new installations use DEB or RPM packages! The updated kickstart script has several advantages over the old one:
- It’s more advanced because it automatically selects the best supported installation method for your system. However, you can still explicitly ask for a specific type of installation method.
- It’s more convenient as it requires no manual installation of packages on a majority of systems.
- It’s more resource efficient on most systems, meaning less impact on your running workloads (and much faster installs on idle systems).
📄 Find the updated install documentation on our official docs site.
If you were using the old kickstart.sh script through a custom script or orchestration tool, you may need to update the options being passed to get it to behave like it used to (this will usually just involve adding --build-only to the options).
Other installation types do not need to make any changes because of this.
Stream compression (tech preview)
The Agent's streaming mechanism now supports stream compression. Streaming thousands of metrics between Netdata Agents increases your data availability and provides a more robust mechanism to monitor your metrics and troubleshoot problems.
Stream compression allows you to:
- Save up to 70% of bandwidth by reducing the size of transmitted metrics between Netdata Agents.
- Therefore, reduce costs over metered data connections by up to 70%.
- Take advantage of low-speed connections.
Stream compression uses the lossless "LZ4 - Extreme fast compression" library. It achieves compression speeds up to 800Mbps, decompression speeds up to 4500Mbps with an average compression ratio between 2.0 and 3.0. Because this is a technical preview and we are still working to make it amazing, stream compression will be disabled by default.
📄 Learn how to enable streaming between nodes.
📄 If you already stream between nodes, learn how to enable streaming compression
Note: Stream compression only works if all participating Netdata Agents are hosted on an OS which supports the library version lz4 v1.9.0+. If a Netdata Agent does not detect the lz4 v1.9.0+ library version, it will disable stream compression.
eBPF CO-RE support
In v1.32 we added some major improvements to our eBPF support. For this release, we’re taking the next step by gradually introducing BPF CO-RE support!
Today, the distribution of eBPF programs is very challenging, because trying to compile an eBPF program with so many different Linux kernels is so complex. We want to make eBPF widely available to everyone without worrying about compatibility. And here is where eBPF CO-RE (Compile Once, Run Everywhere), part of libbpf, comes to the rescue.
CO-RE is a modern approach to writing portable BPF applications that can run on multiple kernel versions and configurations without modifications and runtime source code compilation on the target machine. We now have the opportunity to focus on what matters, add more features, and improve performance of our eBPF offering!
Furthermore, in this release we also introduce two new eBPF charts:
- Threads info: Displays the total number of active eBPF threads and the number of all eBPF threads.
- Load info: Measures the number of eBPF threads running on legacy code or CO-RE.

Acknowledgments
We would like to thank our dedicated, talented contributors that make up this amazing community. The time and expertise that you volunteer is essential to our success. We thank you and look forward to continue to grow together to build a remarkable product.
- @NikolayS for various improvements of python.d/postgres collector.
- @Saruspete for fixing handling of port_rcv_data and port_xmit_data counters in proc/infiniband collector.
- @ardabbour for fix errors in exporting walkthrough.
- @avstrakhov for adding LZ4 streaming data compression.
- @boxjan for fixing permissions of plugins for static builds.
- @candrews for adding a note that Netdata is available on Gentoo.
- @cmd-ntrf for fixing claim node examples in kickstart(-64) documentation.
- @jsoref for fixing spelling.
- @laned130 for adding a missing expression operator to the health configuration reference.
- @lokerhp for fixing a typo in the dashboard_info.js.
- @neotf for adding memory usage chart to python.d/spigotmc collector.
- @pbouchez for adding bar1 memory usage chart to python.d/nvidia_smi collector.
- @scatenag for fixing collecting user statistics for LDAP users in python.d/nvidia_smi collector.
- @sourcecodes2 for adding channels support to PushBullet notification method.
- @bompus for fixing collecting replica set stats in go.d/mongodb collector.
Collectors
Improvements
- Prefer python3 if available (python.d) (#12001, @ilyam8)
- Add bar1 memory usage chart (python.d/nvidia_smi) (#11956, @pbouchez)
- Add a note that Netfilter's "new" and "ignore" counters are removed in the latest kernel (#11950, @ilyam8)
- Consider mat. views as tables in table size/count chart (python.d/postgres) (#11816, @NikolayS)
- Use block_size instead of 8*1024 (python.d/postgres) (#11815, @NikolayS)
Bug fixes
- Fix handling of port_rcv_data and port_xmit_data counters (proc/infiniband)(#11994, @Saruspete)
- Fix handling of decoding errors in ExecutableService (python.d) (#11979, @ilyam8)
- Fix lack of sufficient system capabilities (perf.plugin) (#11958, @vlvkobal)
- Fix Netfilter accounting charts priority (nfacct.plugin) (#11952, @ilyam8)
- Fix lack of sufficient system capabilities (nfacct.plugin) (#11951, @ilyam8)
- Fix collecting user statistics for LDAP users (python.d/nvidia_smi) (#11858, @scatenag)
- Fix tps decode, and add memory usage chart (python.d/spigotmc) (#11797, @neotf)
- Fix collecting replica set stats (go.d/mongodb) ([#639](https://github...
v1.32.1
Netdata v1.32.1
Netdata v.1.32.1 is a patch release to address issues discovered since 1.32.0.
This release contains bug fixes and documentation updates, including clarified instructions for ACLK and our Machine Learning (ML) functionality.
We appreciate our community's help in identifying and diagnosing these issues so we could fix them quickly.
We encourage users to upgrade to the latest version at their earliest convenience.
Acknowledgments
- @boxjan For providing a fix to correctly pass arguments in static builds.
Documentation
- Clean up anomaly-detection guide docs (#11901, @andrewm4894)
- Add Swagger docs for new
/api/v1/aclkendpoint (#11881, @underhood) - Minor ACLK documentation updates (#11882, @underhood)
- Add z score alarm example (#11871, @andrewm4894)
- Create ML README.md (#11848, @andrewm4894)
- Update nightly badge link (#11843, @ilyam8)
Packaging / Installation
- Fix postdrop handling for systemd systems. (#11885, @Ferroin)
- Don't produce output when static update succeeded (#11879, @ilyam8)
- Make netdata-updater.sh POSIX compliant. (#11755, @Ferroin)
- Fix exit code when updating static install && updater script (#11873, @ilyam8)
- Fix passing of extra arguements in static builds (#11852, @boxjan)
- Explicitly conflict with distro netdata DEB packages. (#11855, @Ferroin)
- Bump static builds to use Alpine 3.15 as a base. (#11836, @Ferroin)
- Detect whether libatomic should be linked in when using CXX linker. (#11818, @vkalintiris)
- Fix token name in release draft workflow. (#11847, @Ferroin)
- Remove OpenSUSE Leap 15.2 from CI. (#11600, @Ferroin)
- Remove Fedora 33 from CI. (#11640, @Ferroin)
Bug Fixes
v1.32.0
Release v1.32.0
The newest version of Netdata, v.1.32.0, propels us toward the end of the year, and the Netdata community is positioned to grow stronger than ever in 2022. Before we get into specifics of the new release, it's worth reflecting on that growth.
Netdata open-source Agent growth
The open-source Netdata Agent, the best OSS node monitoring and troubleshooting ever, currently has:
- 1,000,000 unique Netdata nodes live!
- 330,000 engineers using the agent per month!
- Our open-source community growing at an amazing rate, with 3,000 new nodes and 8,000 users per day!
- 250,000 Docker pulls per day with 360 million total, according to DockerHub!
Netdata Cloud growth
The Netdata Cloud, our infrastructure-level, distributed, real-time monitoring and troubleshooting orchestrator, is also showing similar growth, with:
- 35,000 live Netdata nodes!
- 90,000 engineers signed up with 200 new sign-ups every day!
- 180 new spaces created every day!
We are not just pleased with this amazing adoption rate, we are inspired by it. It is you users who give us the energy and confidence to move forward into a new era of high-fidelity, real-time monitoring and troubleshooting, made accessible to everyone!
Thank you for the inspiration! You rock!
Community News
As many of you know, even though we are not endorsed by CNCF, Netdata is the fourth most starred project in the CNCF landscape. We want to thank you for this expression of your appreciation. If you love Netdata and haven't yet, consider giving us a Github star.
Additionally, we invite you to join us on our new Discord server to continue our growth and trajectory, but also to join in on fun and informative live conversations with our wonderful community.
v1.32.0 at a glance
The following offers a high-level overview of some of the key changes made in this release, with more detailed description available in subsequent sections.
New Cloud backend and Agent communication protocol
This Agent release supports our new Cloud backend. From here, we will be offering much faster and simpler communication, reliable alerts and exchange of metadata, and first-time support for the parent-child relationship of Netdata agents. This is the first Agent release that allows Netdata Cloud to use the Netdata Agent as a distributed time-series database that supports replication and query routing, for every metric!
eBPF latency monitoring, container monitoring, and more
We use eBPF to monitor all running processes, without the cooperation of the processes and without sniffing data traffic. This new release includes 13 new eBPF monitoring features, including I/O latency, BTRFS, EXT4, NFS, XFS and ZFS latencies, IRQs latencies, extended swap monitoring, and more.
Machine learning (ML) powered anomaly detection
This release links Netdata Agent with dlib, the popular C++ machine learning algorithms library, which we use to automatically detect anomalies out-of-the-box, at the edge! Once enabled, Netdata trains an ML model for every metric, which is then used to detect outliers in real-time. The resulting "anomaly bit" (where 0=normal, 1=anomalous) associated with each database entry is stored alongside the raw metric value with zero additional storage overhead! This feature is still in development, so it is disabled by default. If you would like to test it and provide feedback, you can enable the feature using the instructions provided in the Detailed release highlights section.
New timezone selector and time controls in the user interface
We implemented a new timezone picker and time controls to enhance administrative abilities in the dashboard.
Docker image POWER8+ support
Netdata Docker images now support recent IBM Power Systems, Raptor Talos II, and more.
And more...
Four new collectors, 112 total improvements, 95 bug fixes, 49 documentation updates, and 57 packaging and installation changes!
Detailed release highlights
New Cloud backend and Agent communication protocol
It's no secret that the best of Netdata Cloud is yet to come. After several months of developing, testing, and benchmarking a new architectural system, we have steadied ourselves for that growth. These changes should offer notable and immediate improvements in reliability and stability, but more importantly, they allow us to quickly and efficiently develop new features and enhanced functionality. Here's what you can look for on the short-term horizon, thanks to our new architecture:
- Greater capacity: The new architecture will change the communication protocol between the Agent and the Cloud to be incremental, improving our agent-handling capacity by ensuring that the Cloud uses measurably less bandwidth.
- Parent/child relationships: The new architecture will allow, for the first time, the recognition of parent child relationships in the Cloud. These changes will enable you to change storage configuration on parents, limit sent metrics, and reduce data frequency to achieve a longer data retention for your nodes. Atop of this, we will continue to develop the ability for you to have complex setups to scale your monitoring with parents as proxies. Ultimately, this will enable Netdata to operate as a headless connector with the lowest footprint possible on your production nodes.
- Alerts: The new architecture will host a multitude of improvements on our alerts presentation over the coming months, allowing for enhanced reliability, alert management, alert logs to be collected in the Cloud, and more.
If you would like to be among the first to test this new architecture and provide feedback, first make sure that you have installed the latest Netdata version following our guide. Then, follow our instructions for enabling the new architecture.
eBPF container monitoring
We did a lot of work to enhance our eBPF container monitoring this release. First, we start with the development of full eBPF support for cgroups. As a refresher on just how important this update is: cgroups together with Namespaces are the building blocks for containers, which is the dominant way of distributing monitoring applications. We use cgroups to control how much of a given key resource (CPU, memory, network, and disk I/O) can be accessed or used by a process or set of processes. Our eBPF collector now creates charts for each cgroup, which enables us to understand how a specific cgroup interacts with the Linux kernel! 🤓
This enhances our already extensive monitoring by including cgroups for mem, process, network, file access, and more.
eBPF latency monitoring
By enabling eBPF monitoring on all systems that support it, Netdata has already been established as a world-leading distributor of eBPF! We use eBPF to monitor all running processes, without the cooperation of the processes, by tracking any way the application interfaces with the system. And in this release, we continue our commitment to further improve eBPF by tracking latencies by disks, IRQs, etc.
Our new eBPF latency features include:
- A new set of Disk I/O latency charts, which monitor the time that it takes for an I/O request to complete. As many of you may know, this is the most important metric for storage performance!
- Latency IRQs monitoring to help anyone with time spent servicing interrupts (hard or soft).
- A new Filesystem submenu that adds latency monitoring for different filesystems: BTRFS, Ext4, NFS, XFS and ZFS. The latency monitoring was brought for the most common functions, like latency for each open request and latency for each sync request.
eBPF is a very strong addition to our monitoring tools, and we are committed to provide the best experience with monitoring with eBPF from a distance without disrupting the data flow!
Other eBPF enhancements
But we didn't stop there with eBPF in v1.32.0. We also provided the following updates:
- We moved VFS to a Filesystem menu to simplify the visualization of events realized by filesystems. This allows you to monitor actions of filesystems and their latency.
- Until now, Netdata had metrics that demonstrated the amount of swap usage. eBPF.plugin now extends the swap monitoring to show how a specific application group/cgroup is performing action on SWAP.
- We have improved process management monitoring by adding monitoring to shared memory and using tracepoints to monitor process creation and exit with more accuracy.
- Netdata also brings monitoring for OOM Kill events for each apps groups defined on host.
If you share our interest in eBPF monitoring, or have questions or requests, feel free to drop by our Community forum to start a discussion with us.
Machine learning (ML) powered anomaly detection
Machine learning (ML) is undeniably a wave of the future in monitoring and troubleshooting. The Netdata community is riding that wave forward together, ahead of everyone else. Netdata v.1.32.0 introduces some foundational capabilities for ML-driven anomaly detection in the agent. We have integrated the popular dlib c++ ml library to power unsupervised anomaly detection out-of-the-box.
While this functionality is still under development and subject to change, we want to develop this with you, as a team. The functionality is disabled by default while we dogfood the feature internally and build additional ML-leveraging features into Netdata...
v1.31.0
The v1.31.0 release of Netdata comes with re-packaged and redesigned elements of the dashboard to help you focus on your metrics, even more Linux kernel insights via eBPF, on-node machine learning to help you find anomalies, and much more.
This release contains 10 new collectors, 54 improvements (7 in the dashboard), 31 documentation updates, and 29 bug fixes.
At a glance
We re-packaged and redesigned portions of the dashboard to improve the overall experience. Part of this effort is better handling of dashboard code during installation—anyone using third-party packages (such as the Netdata Homebrew formula) will start seeing new features and the new designs starting today. The timeframe picker has moved to the top panel, and just to its right are two counters with live CRITICAL and WARNING alarm statuses for your node. Click on either of these two open the alarms modal.
We've also pushed a number of powerful new collectors, including directory cache monitoring via eBPF. By monitoring directory cache, developers and SREs alike can find opportunities to optimize memory usage and reduce disk-intensive operations.
Our new Z-scores and changefinder collectors use machine learning to let you know, at a glance, when key metrics start to behave oddly. We'd love to get feedback on these sophisticated, subjective new brand of collectors!
Netdata Learn, our documentation and educational site, got some refreshed visuals and an improved navigation tree to help you find the right doc quickly. Hit Ctrl/⌘ + k to start a new search!
Update now
If you're not receiving automatic updates on your node(s), check our update doc for details.
Acknowledgments
- @jsoref for fixing numerous spelling mistakes.
- @Steve8291 for improving plugins error logging on restart and documentation improvement.
- @vincentkersten for updating the nvidia-smi collector documentation.
- @Avre for updating the install on cloud providers doc.
- @endreszabo for adding renaming libvirtd LXC containers support.
- @RaitoBezarius for adding attribute 249 support to the
smartd_logmodule. - @Habetdin for updating the
fpingversion. - @wangpei-nice for fixing
.deband.rpmpackaging of the eBPF plugin. - @tiramiseb for improving the installation method for Alpine.
- @BastienBalaud for upgrading the OKay repository for RHEL8.
- @tknobi for adding the Nextcloud plugin to the third-party collector list.
- @jilleJr for adding IPv6 listen address example to the Nginx proxy doc.
- @cherouvim for formatting and wording in the Apache proxy doc.
- @yavin87 for fixing spelling in the infrastructure monitoring quickstart.
- @tnyeanderson for improving
dash-example.html. - @tomcbe for fixing Microsoft Teams notification method naming.
- @tnyeanderson For improving the
dash-exampledocumentation. - @diizzyy for fixing a bug in the FreeBSD plugin.
Improvements
- Automatically trigger Helmchart PR on Agent release. (#11084, @Ferroin)
- Implement ACLK env endpoint. (#10833, @underhood)
- Implement new HTTPS client for ACLK. (#10805, @underhood)
- Update ACLK passwd endpoint to match specifications of the new architecture. (#10859, @underhood)
- Implement ACLK new backoff (TBEB) architecture. (#10941, @underhood)
- Add functionality to store
node_idfor a host. (#11059, @stelfrag) - Remove version negotiation from ACLK-NG .(#10980, @underhood)
- Persist claim IDs in local database for parent and children. (#10993, @stelfrag)
- Provide more agent analytics to PostHog. (#11020, @MrZammler)
- Reduce logging when sending agent analytics. (#11091, @MrZammler)
- Remove error message on Netdata restart. (#8685, @Steve8291)
- Add a timeout when sending anonymous statistics using
curl. (#11010, @ilyam8) - Improve
dash-example.html. (#10870, @tnyeanderson) - Add
host_cloud_enabledattribute to analytics. (#11100, @MrZammler)
Dashboard
- Bundle the react dashboard code into the agent repo directly. (#11139, @Ferroin)
- Add dashboard info strings for
systemdunitscollector. (#10904, @ilyam8) - Update dashboard version to v2.17.0. (#10856, @allelos)
- Top bar, side panel and overall navigation has been redesigned.
- Top bar now includes a light bulb icon with news/features and the number of
CRITICALorWARNINGalarms. - Documentation and settings buttons moved to the sidebar.
- Improved rendering of sign in/sign up option button along with an operational status option (under user settings).
- In the left panel, nodes show a status badge and are now searchable if there are more than 4.
Health
Improvements
- Add
chartsconfiguration option to templates. (#11054, @thiagoftsm) - Add new attributes to health configuration files. (#10961, @MrZammler)
- Add
inconsistentstate to themysql_galera_cluster_statealarm. (#10945, @ilyam8) - Add systemdunits collector alarms. (#10906, @ilyam8)
- Use
averageinstead ofsumin VerneMQ alarms. (#11037, @ilyam8) - Check configuration for
CUSTOMandMSTEAM. (#11113, @MrZammler) - Reduce alarms notifications dump logging. (#11116, @ilyam8)
Bug fixes
- Add
synchronization.confto the Makefile. (#10907, @ilyam8) - Fix Microsoft Teams naming. (#9905, @tomcbe)
Collectors
New
- Add a chart for out of memory kills. (#10880, @vlvkobal)
- Add a chart with Netdata uptime. (#10997, @vlvkobal)
- Add a module for ZFS pool state. (#11071, @vlvkobal)
- Add a plugin for the system clock synchronization state. (#10895, @vlvkobal)
- Add new charts for extended disk metrics. (#10939, @vlvkobal)
- Add support for renaming libvirtd LXC containers. (#11006, @endreszabo)
- Add a metric for Percpu memory. (#10964, @vlvkobal)
- Add an eBPF directory cache collector. (#10855, @thiagoftsm)
- Add a Z-scores python collector. (#10673, @andrewm4894)
- Add changefinder python collector. (#10672, @andrewm4894)
Improvements
- Remove dots in ...
v1.30.1
This is a patch release to address discovered issues since 1.30.0.
Acknowledgments
- @jsoref for fixing numerous spelling mistakes.
Documentation
- Fix grammar in ACLK README.md. (#10898, @slimanio)
- Update news and GIF in README, fix typo. (#10900, @joelhans)
- Fix spelling mistakes in various places. (#10428, @jsoref)
Packaging / Installation
- Don’t use glob expansion in argument to
cdin updater. (#10936, @Ferroin) - Bumped version of OpenSSL bundled in static builds to 1.1.1k. (#10884, @Ferroin)
- Fix bundling of ACLK-NG components in dist tarballs. (#10894, @Ferroin)